Executives have been asking for a holistic view of the enterprise applications and infrastructure for years, leading many organizations to push massive amounts of infrastructure metrics and metadata into data lakes. This can add value by enabling the analysis of disparate data sources, but has resulted in a slew of overly complex, hard to maintain, expensive, and siloed IT management solutions.
Enterprise reporting teams have been using a variety of reporting tools such as Microsoft Report Builder, Cognos, Tableau, SAS, Crystal reports, and others to aggregate the information into meaningful management views for the enterprise.
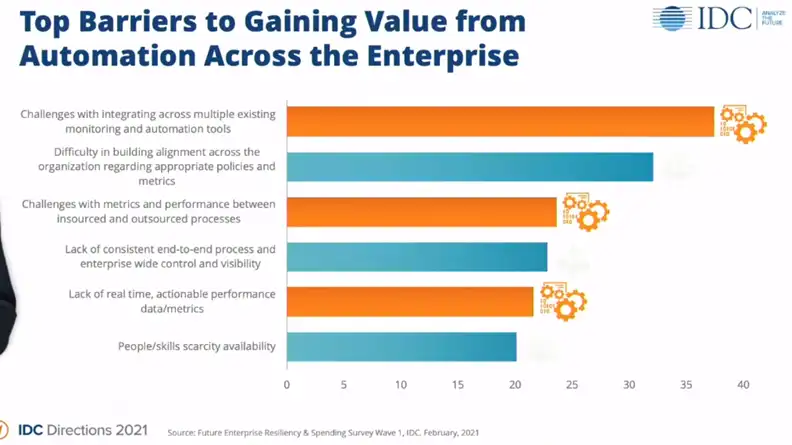
But according to a recent IDC study on automation and monitoring tools, the number 1 barrier to gaining value from enterprise integration is “Challenges with integrating monitoring and automation tools”.
So despite the benefits, clearly just uploading data into reporting tools and hoping to get meaningful, accessible, and usable data across IT groups is not the answer.

Source: Future Enterprise Resiliency & Spending Survey Wave 1, IDC, February, 2021
Modern Enterprise Application and Infrastructure Reporting Tools
Over the last decade, new reporting platforms like Splunk, Snowflake, ELK stack, and others have modernized the development of the enterprise application and infrastructure reporting by providing scalable and flexible methods for ingesting and reporting on time series data.
There are a number of advantages these modern platforms and their associated ecosystems have over the prior generation, including their ability to process massive amounts of log data in near real time, conduct sophisticated statistical time series correlation analysis, and support a wide variety of IT components.
The cost models of these vendors vary, but there is usually a cost associated with the processing per GiB that can be significant for large environments.
These platforms are tool sets that you can use to bring in (ingest) data from your IT environment into a common format. Their ecosystems are materially enhanced by numerous third-party vendors that have provided methods for forwarding and managing the ingress of data, and many of the technology vendors provide low cost or free third-party applications for reporting. There are also hybrid integrated platform as a service offerings (IPAAS) that provide an ecosystem around the data abstraction layer to help accelerate the adoption of a data lake implementation.
Getting Data into Reporting Platform
Whether you use some pre-written collector from an IPAAS or something directly from the enterprise reporting solution’s ecosystem, you have to get the data into the reporting platform. Many of the IT connectors also have reporting plug-ins that allow you to quickly report applications for the thing that you are interested in (e.g. – EMC VMAX performance).
While this is a fairly simple process in theory, it has some shortcomings:
- If you want additional data from a data source you have to modify the code (get your hands dirty)
- If you want to report the platform-specific performance data from EMC VMAX, NetApp, Pure, IBM, HPE, etc, along with other IT data (like from VMware systems that run on those platforms) you have to create new reports that pull from additional sources.
- If you want the time stamps synchronized across platforms you must take care to ensure that the time stamps across the data sources are aligned
- Topology information used to identify how an IT component relates to another component is not explicitly defined in the logs or metrics data
- You may be ingesting metrics into the reporting platform that are not critical and since you are getting charged per GiB you upload, it is very important to be able to precisely tune what metrics are ingested.
If you are not careful, you will be looking at time series data from multiple platforms that is aligned incorrectly which will cause significant confusion. It can also mean that you have no way to understand how individual components relate to one another. Without this information you are creating islands in the lake.
So, the good news is that there are lots of pre-built data collectors and pre-built reporting add-ons available for individual technology components (z/OS systems, Storage, Tape, VMware). The bad news is that in addition to cobbling your own solutions together in these platforms, in essence, recreating the wheel, if you are not careful, you will be creating new islands of information requiring deep understanding of each individual data source.
It also means that for each platform and technology you ingest into your platform instance, you will be responsible for figuring out how to correlate the data both from a time perspective and from a topology perspective.
In a large and complex IT infrastructure, the number and types of data represented may result in hundreds of islands that may not be able to be stitched together. Any homegrown solution will also require maintenance and specialized skills which adds additional risk for skills gaps when that technology ages out.
Comprehensive Infrastructure Application Reporting and Topology Correlation
If your goal is to provide a single pane of glass with reports on individual technology elements then it is a straightforward process to start using an enterprise reporting platform, though it will require some light programming. However, in order to provide a comprehensive, end-to-end, fully time synchronized solution, you will need to invest significant time and energy to get it right and you still may not end up with a solution that allows for cross domain troubleshooting.
IntelliMagic Vision for z/OS provides comprehensive z/OS infrastructure and application integrated reporting and topology correlation. It addresses the time synchronization issues across the z/OS stack as well as provides built-in topology correlation so that you can understand how all of the components connect to each other.
IntelliMagic Vision for SAN does that same thing for the distributed I/O stack for storage, SAN, and VMware. Its modern interface embeds artificial intelligence to proactively identify risks in your infrastructure, hasten time to resolution for performance issues, optimize your infrastructure configuration and elevate your team’s effectiveness.
Both of these solutions can forward time synchronized data to the reporting solution of choice eliminating the challenges with multiple sources and time synchronization provided by all of the component specific ingestion solutions.

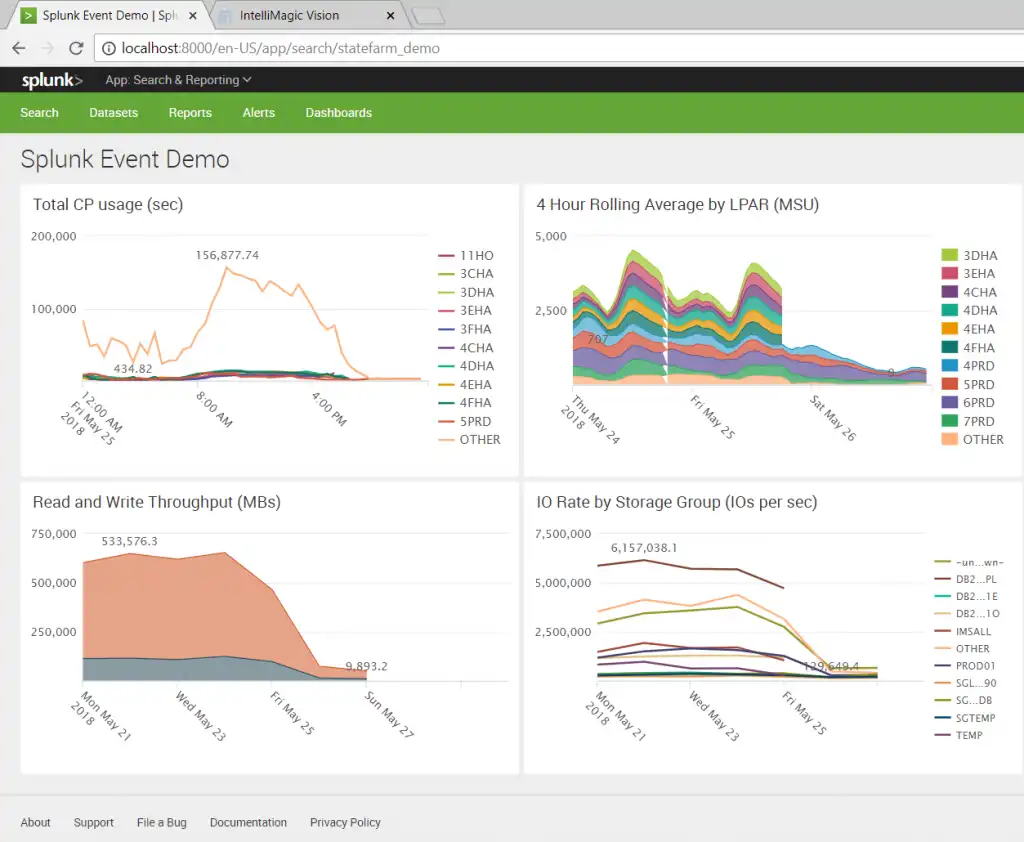
Example of IntelliMagic Vision intelligent data imported into a Splunk dashboard
IntelliMagic has several proven methods for providing our supported data into your enterprise reporting solution either by sending raw data, sending processed data or automating exports of any charts into your data lake.
In addition, IntelliMagic services can provide custom reporting to integrate data from our extensive list of supported technologies with your enterprise reporting solution so that you can address time synchronization issues and topology challenges for a large portion of your IT infrastructure. If you would like to see how we can enable your data lake plans start a free trial here, or send us a message.
This article's author
Share this blog
Related Resources
How to Detect and Resolve “State in Doubt” Errors
IntelliMagic Vision helps reduce the visibility gaps and improves availability by providing deep insights, practical drill downs and specialized domain knowledge for your SAN environment.
Finding Hidden Time Bombs in Your VMware Connectivity
Seeing real end-to-end risks from the VMware guest through the SAN fabric to the Storage LUN is difficult, leading to many SAN Connectivity issues.
Platform-Specific Views: Vendor Neutral SAN Monitoring Part 2
Each distributed system platform has unique nuances. It's important for a solution to be capable of getting the detailed performance data capable of supporting vendor-specific architectures.
Request a Free Trial or Schedule a Demo Today
Discuss your technical or sales-related questions with our availability experts today

 Brett Allison