The amount of memory (or more precisely “real storage” in z/OS terminology) available on the Z platform has increased 40-fold in recent years, going from a limit of 1 TB on a zEC12 processor to 40 TB on a z15. Even though software support has not grown as rapidly, since z/OS 2.2 a single system image can support up to 4 TB – still a good-sized number.
Even if you can’t afford to buy 40 TB, odds are your processors have significantly more memory today than they did even a few years ago. But to what extent are you taking advantage of these larger amounts of memory?
There are many ways to leverage memory on a smaller scale, but only one component is capable of big-time exploitation. Truly, that “elephant in the room” is Db2. As Robert Catterall has indicated in recent conference presentations,”Db2 for z/OS keeps giving us new ways to leverage z/OS real storage for improved application performance and CPU efficiency.”
The chorus to country music star Luke Combs’ hit song “Better Together” has these lyrics:
“Some things just go better together and probably always will
Like a cup of coffee and a sunrise, Sunday drives and time to kill
What’s the point of this ol’ guitar if it ain’t got no strings?
Or pourin’ your heart into a song that you ain’t gonna sing?
It’s a match made up in heaven, like good ol’ boys and beer
And me, as long as you’re right here.”
Like “a cup of coffee and a sunrise” and “good ol’ boys and beer,” z/OS memory and Db2 are indeed “a match made in heaven.”
Leveraging Db2 Buffer Pools
The list of ways Db2 can leverage memory is indeed extensive and continues to expand with each new Db2 release and function level. In a recent blog, “How Much is Enough REAL Storage,” Adrian Burke identified several including EDM and authorization cache pools, persisting threads, Fast Traverse Blocks, contiguous buffer pools, and EDM pool storage allocation techniques.
Though these all provide value, most would agree with Catterall’s statement identifying buffer pools (BPs) as “your single biggest memory-related leverage point.”
As background to help non-Db2 specialists understand why buffer pools play such a vital role, the extent to which getpage requests can be satisfied with data already residing in a buffer (through various prefetch mechanisms) is a primary contributor to Db2 performance and efficiency. Buffer pool hits avoid I/Os that are synchronous with the unit of work (“sync I/Os”) and thus introduce delays into response times. These hits also improve efficiency since accessing data from memory consumes far less CPU than issuing an I/O to request it from disk.
Buffer Pool Tuning Exercises Rely on Key Metrics
The objective of any buffer pool tuning effort is to make best use of the z/OS memory made available to Db2. This amount typically represents an informal understanding between the z/OS and Db2 technical teams, though IEASYSxx LFAREA specifications creating large frames (1MB and possibly 2GB) bring more structure to this arrangement.
The benefits of any such effort rely heavily on the quality of the operational data upon which the analysis is based. Fortunately, the mainframe platform produces an incredibly rich set of metrics far superior to any other. More good news is that no z/OS subsystem provides better instrumentation than Db2. Rest assured that all the metrics needed to enable informed buffer pool tuning analysis are readily available in Db2 Statistics (SMF 100) and Accounting (SMF 101) data.
Now as far as what to do with that data, industry experts propose varied buffer pool tuning approaches. They all draw on a similar common set of metrics but are differentiated by the criteria they select for their primary focus. Proposed top-level criteria include random hit ratio (i.e., percentage of sync I/Os that have been avoided) and page residency time (i.e., average time a page is resident in a buffer pool).
Though buffer pool tuning approaches vary in the primary criteria they select, they are all entirely driven by key metrics and thus greatly aided when those metrics can be accessed with minimal effort. This easy access makes buffer pool tuning exercises less time-consuming and thus increases the likelihood they will be periodically revisited, both to achieve continuous incremental improvement as well as to adjust to changing workloads.
Accessible Metrics Simplify Buffer Pool Tuning Analysis
As an example, let’s select the buffer pool tuning methodology advocated by Catterall in the previously referenced presentation, and see how easy accessibility to metrics could help simplify and expedite that analysis. He identifies total read I/O rate as “the most important buffer pool metric”. That rate includes two types of synchronous reads (random and sequential) and three types of prefetch reads (sequential, list, and dynamic).
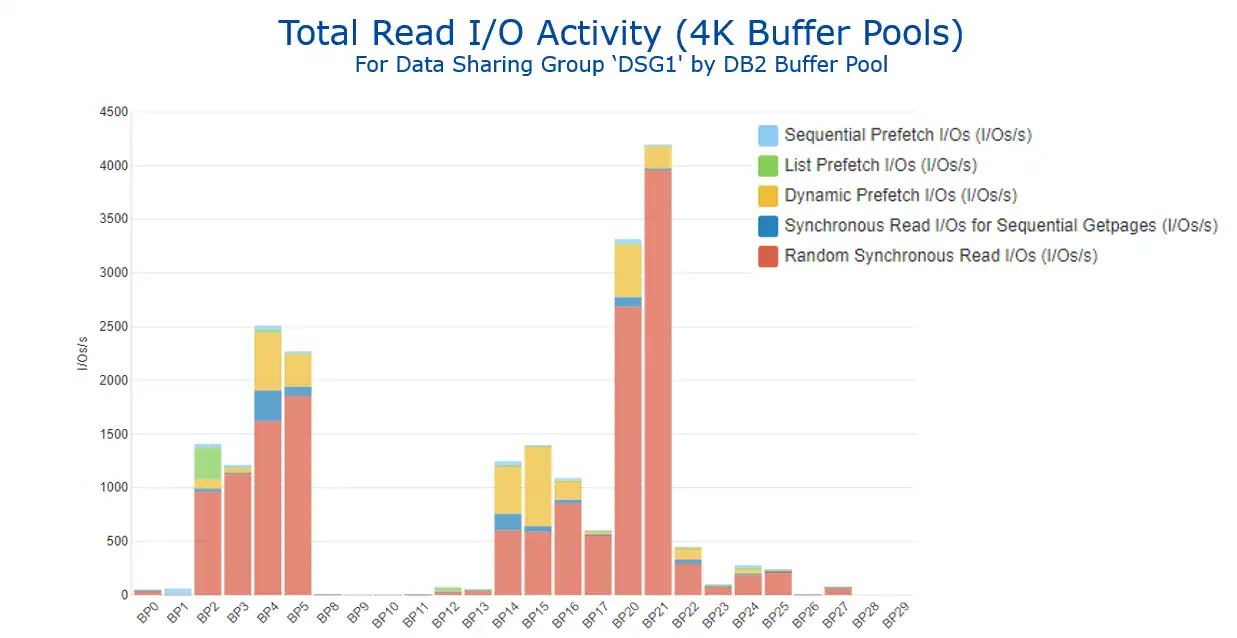
The primary objective of this methodology is to “drive total read I/O rates as low as you can by enlarging buffer pools that have higher read I/O rates.” The following view of total read I/O activity by buffer pool identifies buffer pools 21 and 20 as the initial candidates for increased buffer pool sizes. Note here that random sync read I/Os are by far the largest driver of read I/Os for buffer pool 21, as well as for the other buffer pools with the highest read I/O rates. For this reason, some of the subsequent charts in this blog will focus on random sync read I/Os.
As increases in buffer pool sizes translate into decreases in read I/O rates, this “will improve response time (less I/O wait time) and save CPU (every I/O consumes some CPU time)”.
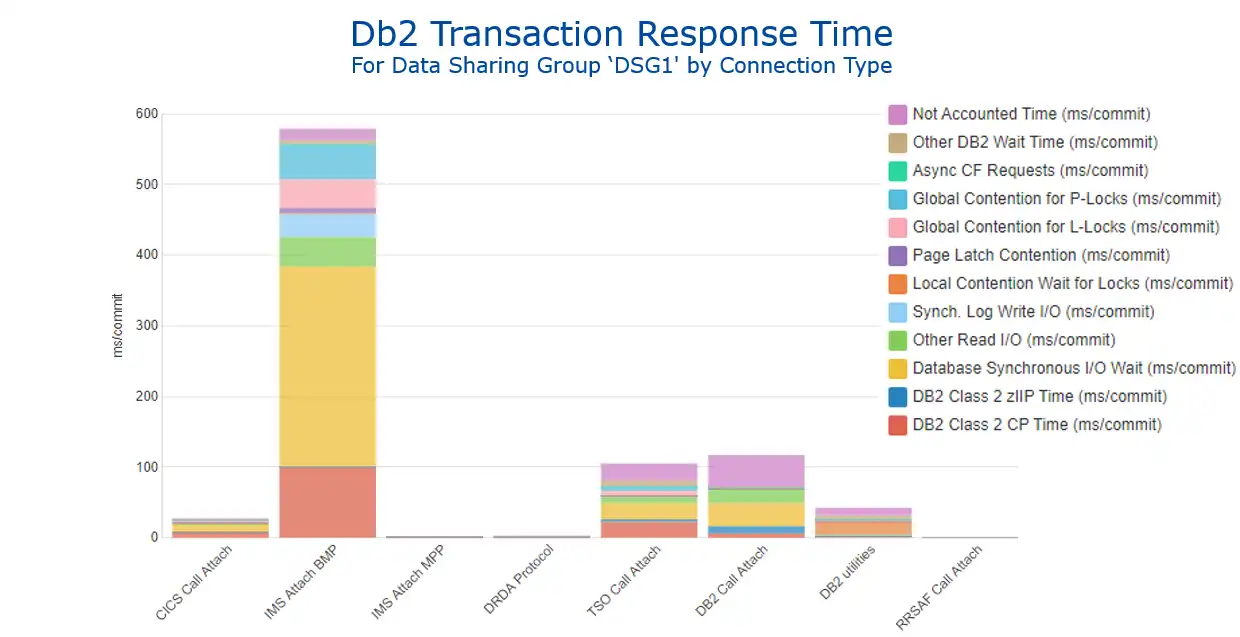
As we prepare to look at the detailed timing metrics, we will follow the common recommendation to view this data aggregated by connection type. The wisdom of this approach is apparent, as seen in Figure 2 of dramatically differing transaction elapsed time profiles between work coming into Db2 from various sources, such as CICS (first bar) and IMS BMP batch (second bar).
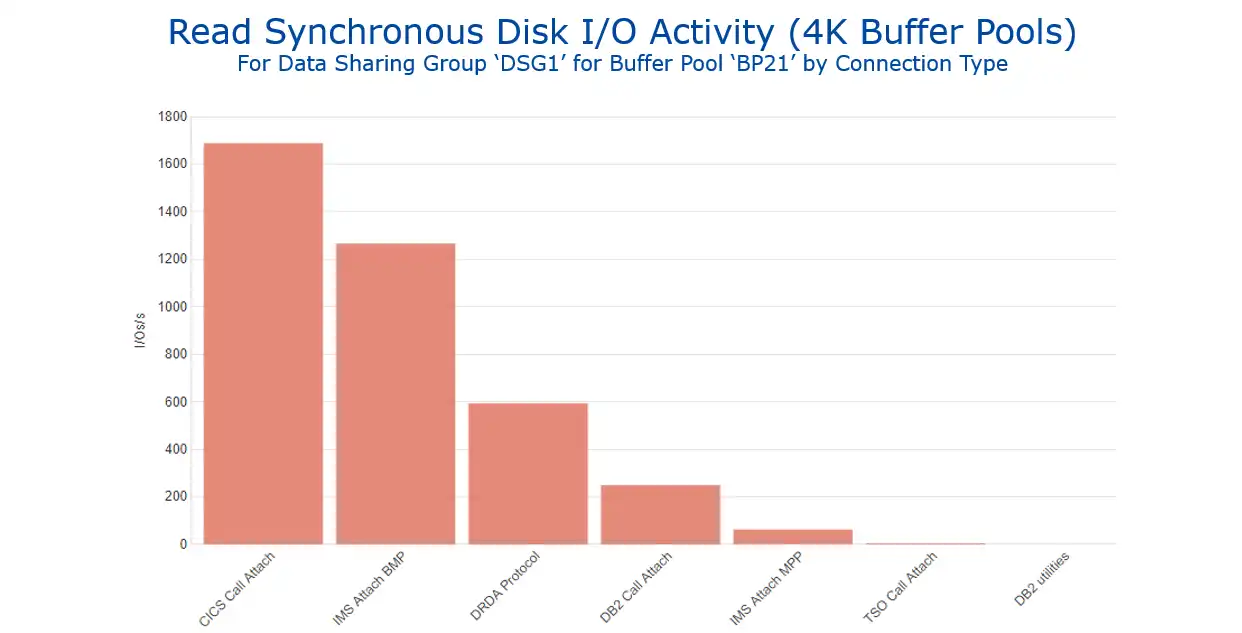
As shown in Figure 1, in this sample tuning exercise BP 21 will be the initial target of action. In preparation for analyzing the elapsed time benefits of reducing its total read I/O rate, we will want to determine the connection type(s) that are primary drivers of activity for that buffer pool. Figure 3 (available with a single drilldown from Figure 1) identifies that CICS is the largest driver of sync read I/Os.
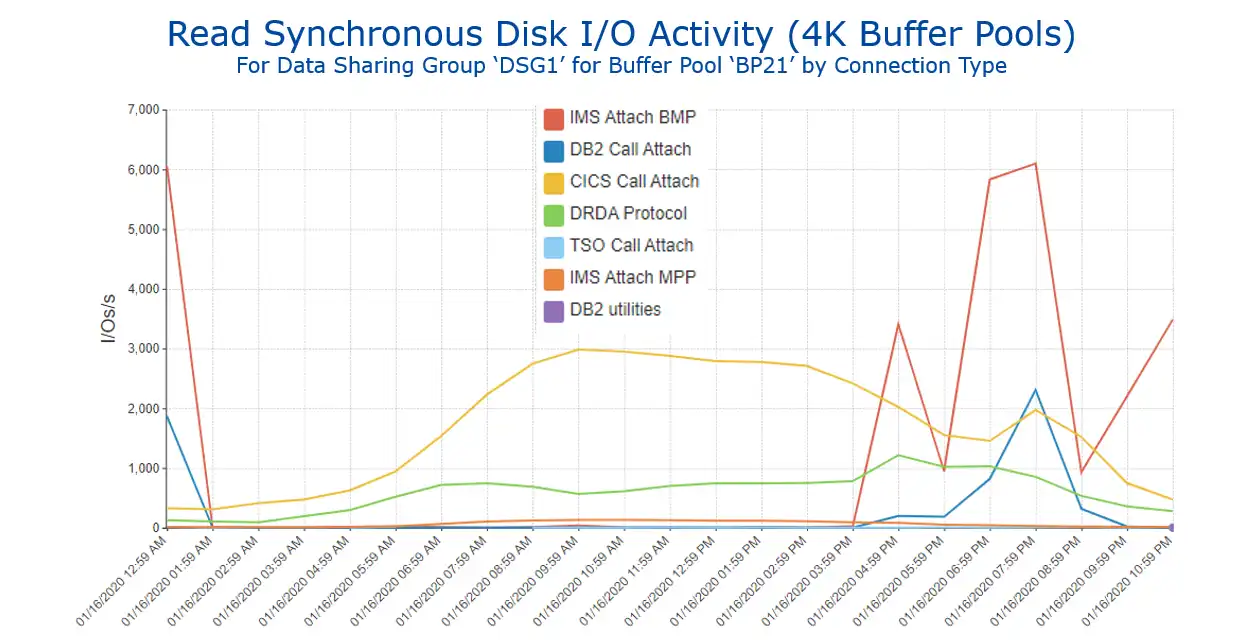
A logical next step would be to view this data over time, as seen in Figure 4, again, available as a single step from Figure 3 through a report customization dialog. This suggests that if we are seeking to analyze the impact of increasing the size of BP21 on elapsed times for the Db2 workload driven from CICS, it makes sense to focus on the day shift. We also see here that if we wanted to analyze the impact on work coming from IMS BMP batch, the second largest driver of sync read I/Os for BP21, we would focus on the evening time interval.
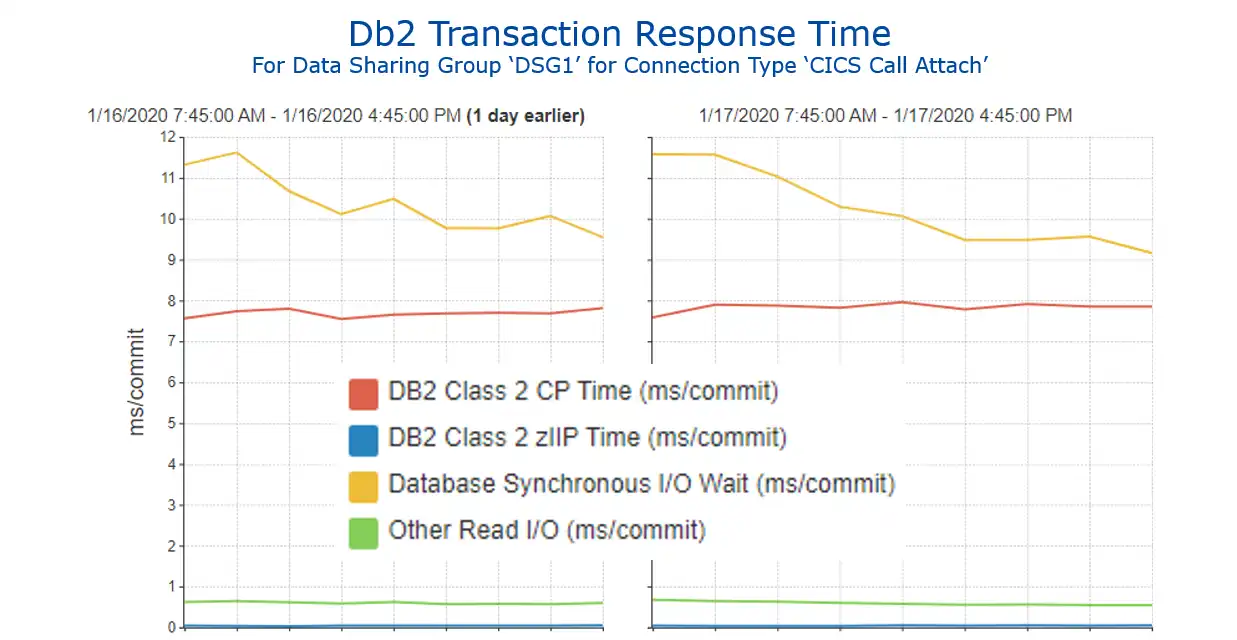
As increases in buffer pool sizes translate into decreasing read I/O rates, we are now positioned to analyze the details of that impact. This methodology focuses attention on anticipated reductions in these average time values:
- Synchronous database read wait time
- “Other” read wait time (i.e., wait for prefetch read)
- Class 2 (i.e., in -Db2) CPU time, both general purpose (GCP) and zIIP
Figure 5 provides this analysis. Again, it is easily created from the earlier “Db2 Transaction Response Time” (Figure 2) by:
- drilling down on CICS Call Attach by time,
- removing all the other time components except those identified above as being of particular interest, and
- comparing “before” and “after” intervals for the buffer pool size change. (Of course, with this sample data there was no intervening change in the buffer pool size, and thus no impact on these metrics.)
Accessible Metrics Enable Continuous Improvement
As indicated earlier, easily accessible data streamlines buffer pool tuning exercises, and makes it feasible to frequently refine the analysis using data from new time intervals. One approach to making this analysis an easily repeatable process is to collect all the pertinent views in a customized dashboard, as illustrated by the example in Figure 6 with the charts from this blog. Then the analysis can be quickly revisited for any new time period to determine the next set of buffer pool pool size change(s), simply by updating the selection intervals on the reports.
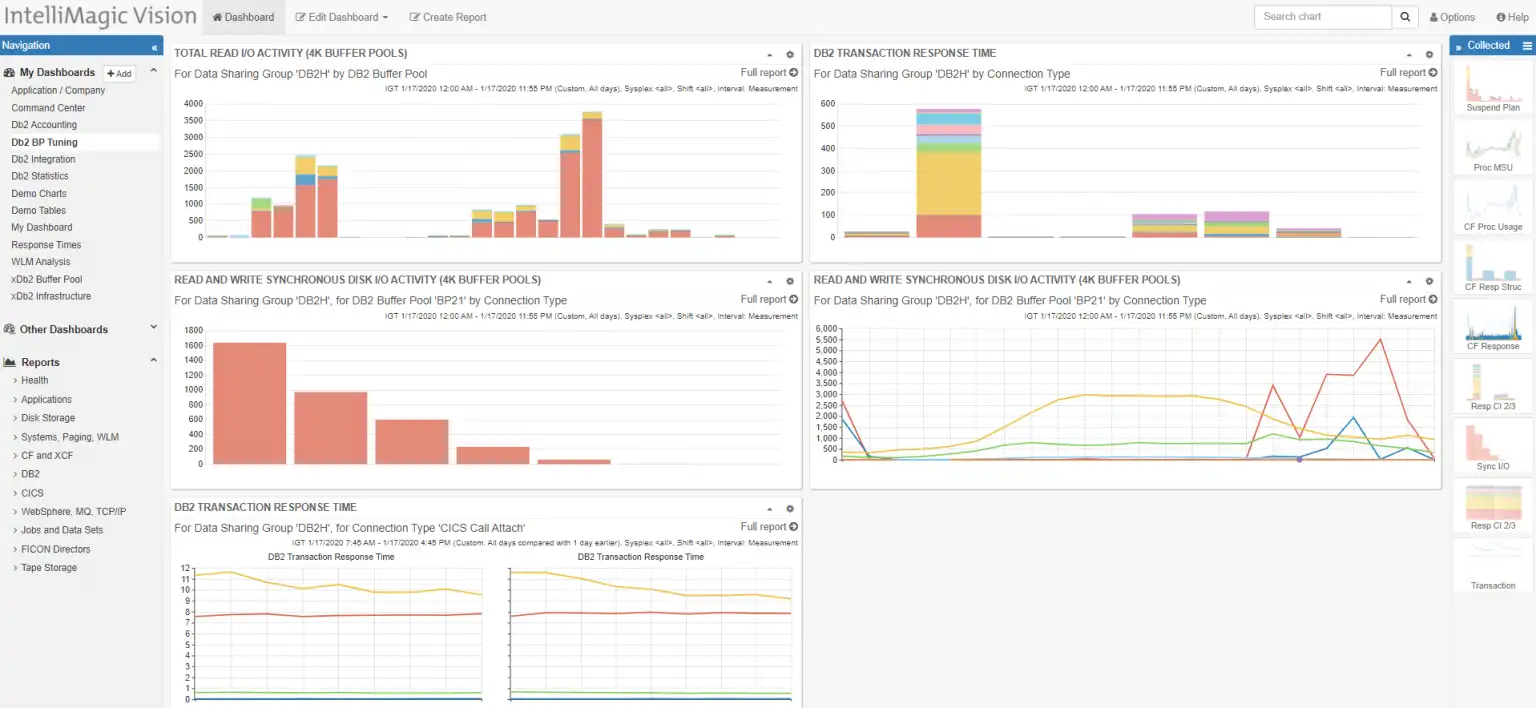
Using one buffer pool tuning methodology as an example, we have seen how a buffer pool tuning exercise can be expedited by easy accessibility into the metrics that drive the analysis. That accessibility also enables efficient and repeated execution of the analytical process, making continuous improvement for buffer pool optimization achievable.
These brief videos show the navigation involved in creating these views (and others) using IntelliMagic Vision and can help visualize how easy accessibility to metrics can enhance buffer pool tuning initiatives.
- “Db2 Buffer Pool Tuning: Exploring Key Metrics (Part 1)” – 4 minutes
- “Db2 Buffer Pool Tuning: Exploring Key Metrics (Part 2)” – 5 minutes
In a subsequent blog, I will explore how additional Db2 metrics along with integration of SMF metrics from another source can enable a potential enhancement in buffer pool tuning methodology.
“SMF Data” and “Great Value for Availability & Performance” – Another Match?
This blog began with the theme of “z/OS Memory and Db2 – A Match Made in Heaven.” It focused on a specific application of the rich potential value of SMF data for mainframe sites, namely Db2 buffer pool tuning initiatives.
Explosive recent growth in hardware support for increased memory sizes, increased acquisitions of memory, and increased Db2 exploitation of memory are trends that are very likely to continue. Opportunities to wisely leverage that additional memory to achieve CPU and elapsed time benefits from increased buffer pool sizes will also continue to be available to sites who are positioned to derive value from their Db2 SMF data.
Thinking more generally, the theme of leveraging easy accessibility to SMF metrics to derive value for your operation suggests another match: “SMF Data” and “Great Value for Availability & Performance.” Is that match happening at your site?
This article's author
Share this blog
You May Also Be Interested In:
What's New with IntelliMagic Vision for z/OS? 2024.2
February 26, 2024 | This month we've introduced changes to the presentation of Db2, CICS, and MQ variables from rates to counts, updates to Key Processor Configuration, and the inclusion of new report sets for CICS Transaction Event Counts.
Viewing Connections Between CICS Regions, Db2 Data Sharing Groups, and MQ Queue Managers
This blog emphasizes the importance of understanding connections in mainframe management, specifically focusing on CICS, Db2, and MQ.
What's New with IntelliMagic Vision for z/OS? 2024.1
January 29, 2024 | This month we've introduced updates to the Subsystem Topology Viewer, new Long-term MSU/MIPS Reporting, updates to ZPARM settings and Average Line Configurations, as well as updates to TCP/IP Communications reports.
Book a Demo or Connect With an Expert
Discuss your technical or sales-related questions with our mainframe experts today

 Todd Havekost