In my previous blog, “How to Gather / Collect Db2 SMF Data,” I covered where to start before analyzing the Db2 statistics data – namely gathering and collecting the SMF data Db2 provides. In this blog I actually go into the analysis of two important Db2 statistics areas: CPU Times and DBAT Activity.
This blog is a shortened version of an article I wrote for Watson and Walker’s Cheryl Watson’s Tuning Letter that includes several other important Db2 statistics areas in addition to CPU Times and DBAT Activity.
This blog, and the above-mentioned article, focuses just on the type 100 statistics records. Future blogs and articles will cover the type 102 performance records, and my colleague, Todd Havekost covered type 101 accounting records here.
CPU Times for Db2 Statistics Records
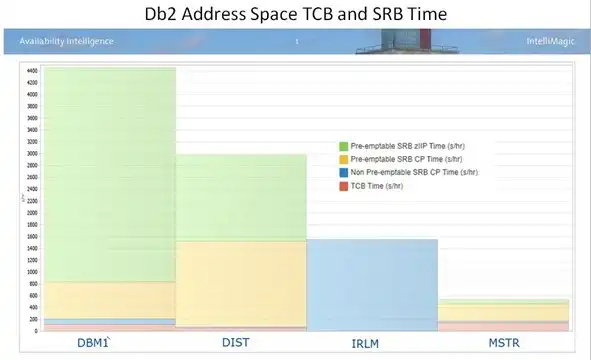
The four basic address spaces used by Db2 use CPs in different ways. The Database Services address space (DBM1) is responsible for managing the datasets used by Db2. In Figure 1 we can see that most of the time is spent in preemptible SRBs that run on zIIP engines. This indicates that buffer pool processing for prefetch and deferred write, as well as castout and log read/write operations, are executing on zIIP engines, which is good.
In the DIST address space, which handles work entering the system via DDF, we see that work is divided almost equally between preemptible CP time and zIIP time. That is because up to 60% of SQL coming from distributed sources is zIIP-eligible. If this ratio were more CP-heavy, it might mean that you are waiting for zIIPs, and this situation should be researched at your site.
The IRLM address space takes care of Db2 locking, and therefore is uniquely non-preemptible.
Finally, the System Services address space (MSTR) is responsible for the management of threads, among other things, and will generally have a mix of the different processor types. Active log reads/writes, performed by the MSTR, can be up to 100% zIIP-eligible. However, archive log reads/writes execute under TCBs and are not zIIP-eligible. Higher TCB times may indicate that having more and larger logs would be helpful. By having larger active logs, archiving is needed less frequently, and reading from the archives would be much less likely in the event of an application rollback.
High MSTR SRB times may be helped by the use of protected threads and high-performance DBATs (more on that later). Since thread creation is handled by SRBs in the MSTR address space, your use of protected threads and how it relates to overall thread creation affects this value. IBM’s recommendation is that the MSTR TCB time should be low compared to the SRB time, but they do not give a target ratio.
Db2 Statistics DBAT Activity
The Db2 Distributed Data Facility (DDF) is the way remote requesters can use Db2 as a server. If those requests are arriving from off-host, they are called Database Access Threads, or DBATs. These are the requests that execute in the DBM1 address space described earlier.
When a request comes into a connection, it creates a (or reuses an existing) thread within Db2. The maximum number of connections and threads are controlled by zparms; CONDBAT (for connections) and MAXDBAT (for threads) respectively. Many connections can use a single DBAT, therefore CONDBAT can be set a good bit higher than MAXDBAT. A connection that is inactive is very inexpensive for Db2 to maintain, but there’s no need to set the limit at the maximum. You need to be aware when the number of connections gets too high. A transaction that hits the CONDBAT limit will receive an error and terminate. Consider what your system needs, and set it accordingly. Monitoring your statistics can provide information about if and when your system exceeds this threshold.
MAXDBAT is another threshold that should be monitored, and it is more important than CONDBAT. If a transaction causes this value to be exceeded, it will be queued until either it is allowed in, or it times out. Statistics metrics will show if either of these limits has been hit.
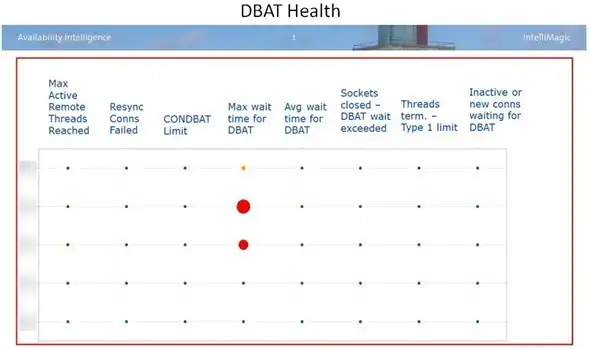
A product like IntelliMagic Vision can produce reports that show where the pain is in your distributed processing. Figure 2 shows that several data sharing groups are having problems with DBAT wait time. But fortunately, MAXDBAT and CONDBAT have not been exceeded. A further look into the wait time for DBATs would be needed.
There is a particular type of DBAT called a High Performance DBAT. This involves a connection where the DBAT, once the transaction has completed, does not immediately go back into the DBAT pool, but remains persistent, waiting for another transaction to reuse it. It is enabled by the use of the RELEASE(DEALLOCATE) bind parameter and the CMTSTAT(INACTIVE) zparm. This greatly reduces the need for CPU to allocate the same resources and acquire the same locks over and over for the same type of work. High performance DBATs will hold onto those resources for 200 units of work, and then terminate.
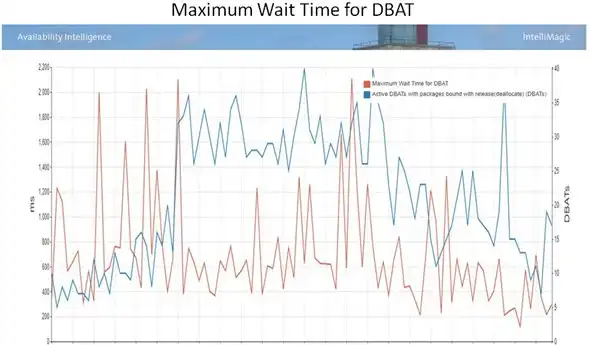
Figure 3 demonstrates the effect that high performance DBATs can have on DBAT wait time. During the period of time the high performance DBATs are in effect, the maximum wait time for DBATs is lower. There is a tradeoff, however; since resources are held until thread deallocation time, there is a small chance of timeouts for other applications that want access to those resources. Also, utilities are prevented from breaking in to do work. High performance DBATs can be turned on and off by a Db2 command: -MODIFY DDF PKGREL(COMMIT) to turn off; -MODIFY DDF PKGREL(BNDOPT) to return packages to their original bind release option. Proper analysis of the use of high-performance DBATs and the particular applications that need to use them should be done by keeping an eye on the statistics and tuning appropriately.
Is hitting MAXDBAT always bad? Not necessarily. If you can’t process all the threads entering your system concurrently without slowing to a crawl, then obviously it’s not a good idea to let them all in at the same time. A little queueing may not be a bad thing. The queue suspension time on a handful of transactions is probably not as disruptive as the slowdown of the entire workload that is currently attempting to run. Other tuning knobs can be used:
- Using the set of profile tables that Db2 provides, you can specify different attributes of workloads and provide desired limits for each of them.
- With WLM service classes, you can set different performance goals for various transactions.
With more and more applications using Db2 for z/OS as a server, it is extremely important to understand and keep track of the use of DDF to make sure you are providing enough connections and handling the use of DBATs so as to maximize your resources and keep your applications running efficiently.
Using SMF Data to Understand Db2 Statistics
As you can see, looking at Db2 statistics can keep us very busy, before we even get to the buffer pools! These examples are truly just the tip of the iceberg when it comes to understanding what is going on at the Db2 system level. It can be daunting to think about all the plates we have to keep spinning in the air.
Hopefully this article has provided some key, but frequently overlooked, aspects of Db2 performance that are reported in the Db2 statistics records. But this is just the start – now the ball is in your court to identify the statistics that are key in your environment.
You can access and read the full reprinted Watson and Walker Tuning Letter, Db2 Statistics: They’re Not Just for Buffer Pools here.
In the Tuning Letter article, I cover everything above as well as dive into much greater detail for all of the below Db2 statistics areas:
- CPU Times
- Work File Usage
- RID Pool Usage
- Data Sharing Locking
- Dynamic Statement Cache
- DBAT Activity
This article's author
Share this blog
You May Also Be Interested In:
What's New with IntelliMagic Vision for z/OS? 2024.2
February 26, 2024 | This month we've introduced changes to the presentation of Db2, CICS, and MQ variables from rates to counts, updates to Key Processor Configuration, and the inclusion of new report sets for CICS Transaction Event Counts.
What's New with IntelliMagic Vision for z/OS? 2024.1
January 29, 2024 | This month we've introduced updates to the Subsystem Topology Viewer, new Long-term MSU/MIPS Reporting, updates to ZPARM settings and Average Line Configurations, as well as updates to TCP/IP Communications reports.
Making Sense of the Many I/O Count Fields in SMF | Cheryl Watson's Tuning Letter
In this reprint from Cheryl Watson’s Tuning Letter, Todd Havekost addresses a question about the different fields in SMF records having different values.
Book a Demo or Connect With an Expert
Discuss your technical or sales-related questions with our mainframe experts today


 Sally Mir