In part 1 of this blog series, I wrote about how to select your Spectrum Virtualize replication technology that matches your business requirements, or more likely, your budget. Now we need to think about how you can monitor and diagnose Spectrum Virtualize performance issues that may be caused by replication.
Occasionally I run into Spectrum Virtualize replication issues and found that not all monitoring and diagnostic tools provide a comprehensive picture of Spectrum Virtualize replication. Further complicating matters, the nature of the technology you have selected will influence expectations and approach to problem determination.
Copy Services Available Within IBM Spectrum Virtualize
If you recall, in Part 1 of this blog I discussed several types of copy services available within IBM Spectrum Virtualize:
- Metro Mirror (MM) for synchronous metropolitan distances that ensures writes to primary and secondary disks are committed prior to the acknowledgment of host write completion.
- Global Mirror (GM) uses asynchronous copy services and is better for low bandwidth situations.
- Global Mirror with Change Volumes (GMwCV) is essentially a continuous FlashCopy that asynchronously updates a remote copy. It completely isolates the primary from WAN issues but takes up significant disk capacity and cache resources locally and also leads to a remote copy that is significantly out of synch with your local copy.
- Stretched Cluster Volume Mirroring: This could also be considered a replication option within Spectrum Virtualize families. In this case, an IBM Spectrum Virtualize cluster has nodes located at two locations allowing real-time copies to be spread across two locations.
- FlashCopy (FC): FlashCopy is a point in time technology. Think of it more like backup software than replication services. Replication services are designed to provide high availability for two copies of data where as FlashCopy is primarily used as point in time copies of volumes. It’s kind of like taking a picture and it allows you to take multiple pictures. Similar to the concept of many frames from a movie. With IBM Spectrum Virtualize multiple target volumes can undergo a FlashCopy for the same source volume. FlashCopy is used in GMwCV.
Using Response Times to Understand Replication Health
As with performance analysis on any technology, response times can provide a quick way to understand the health of replication, provided it reflects reasonable expectations.
One challenge is that the response times vary greatly depending on available and required bandwidth, geography, number of hops, and the distance. So without further interpretation, it is hard to see at first glance if a certain response time is normal, or a sign that there is a problem.
The following table illustrates the best case expected network latency times for a single I/O operation across different distances:

Table 1: Expected network latency times for a single I/O operation across different distances
Tracking the Health of Your Replication Environment
There are several ways to track the health of your replication environment:
1) Proactively Analyze Your Spectrum Virtualize Statistics
Pro-actively analyze your Spectrum Virtualize statistics, including:
a) PPRC Send and Received Tracks/sec and PPRC Send/Received Response time (valid for MM and GM, though not available on GM with change volumes).
Establish a baseline of what you may expect under normal healthy circumstances. With IntelliMagic Vision, we can set meaningful thresholds on the PPRC Send and PPRC Received response times that are based on your situation. The expected values depend on the distance and available bandwidth.
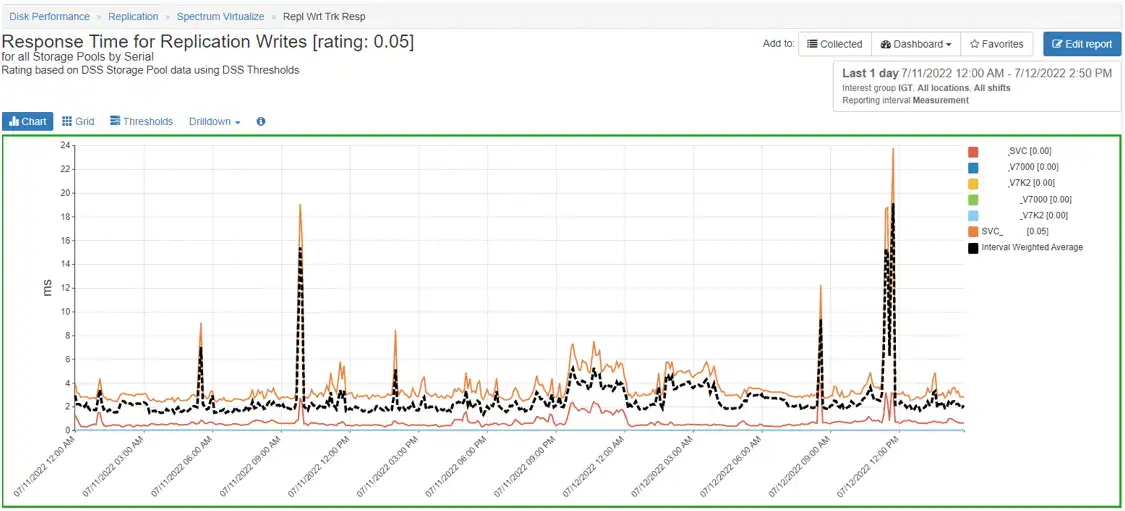
Figure 1 demonstrates a chart that shows and interprets the Response time for Replication Writes.

Figure 1: Response time for Response Writes
You can see from the red border on this chart that IntelliMagic Vision detected that the replication response times were much higher than they should be, indicating a problem that needs to be investigated. IntelliMagic Vision allows you to drill down to the storage pools and volumes to see which volumes are actively transmitting data.
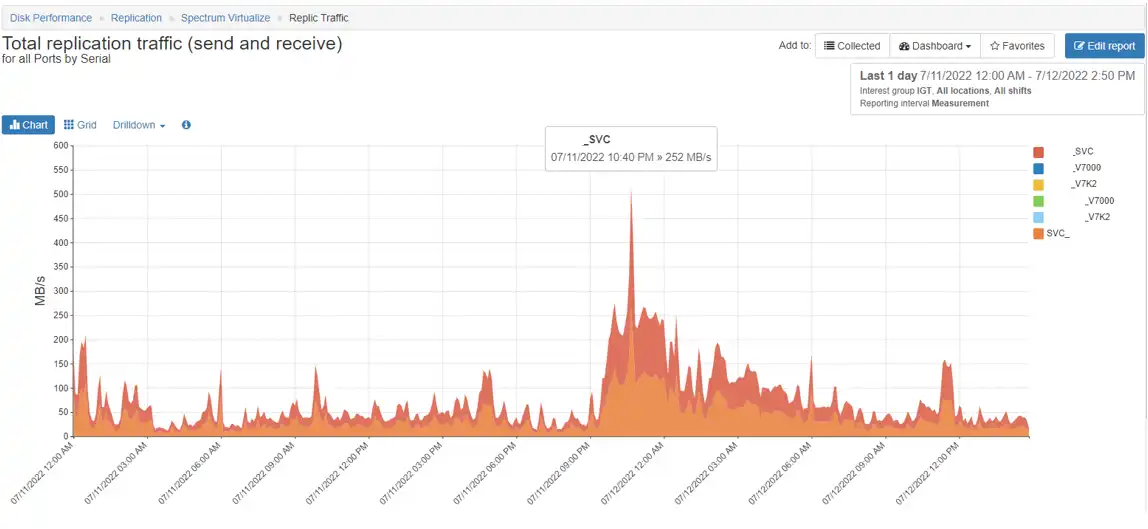
b) IBM Spectrum Virtualize Port Throughput (Send/Received): Monitoring the port traffic dedicated to replication traffic.
This data is available on the port level of the IBM Spectrum Virtualize. It is also easy to monitor if you have dedicated ports for replication. If these metrics show that the throughput is low, but response time is high, then this is likely an indication that there is a problem with the WAN.
Figure 2 demonstrates the total throughput for an IBM Spectrum Virtualize. With IntelliMagic Vision, you can drill down to the I/O Groups, Nodes or ports.

Figure 2: Total Throughput for an SVC
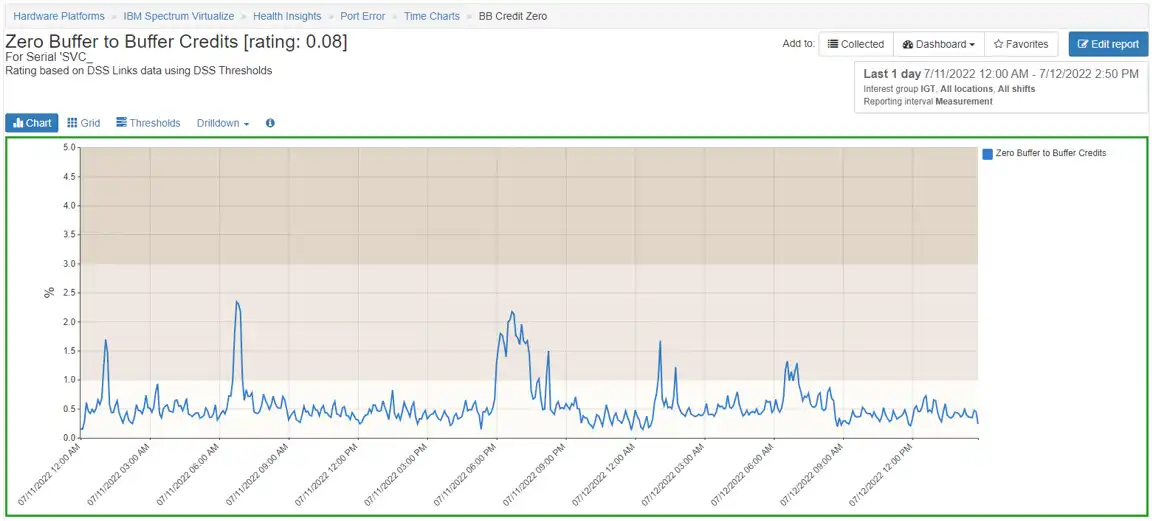
c) SVC Port:
Zero Buffer to Buffer Credit % is often an indication of WAN congestion. It is not uncommon to see some level of shortages as the IBM Spectrum Virtualize is usually capable of sending data faster than the link can support.
Figure 3 demonstrates the average % of zero buffer to buffer credits.

Figure 3: Average % of Zero Buffer to Buffer Credits
d) Port to Local Node Response time: If this increase correlates with zero buffer to buffer credit % increase then the congestion on the WAN may be impacting the front-end write response time.
e) Spectrum Virtualize Front-end Write Response time (Volume, storage pool, node): The front-end write response times should not be high for GM or GM with change volumes. If the front-end write response times are high for source volumes in a GM relationship, it is highly likely that significant WAN congestion exists or there is a performance issue within the downstream IBM Spectrum Virtualize.
2) Use Native IBM Spectrum Virtualize Commands to Monitor Replication Status
Monitor the status of replication sessions with native IBM Spectrum Virtualize commands that inform you of the status of a volume that is in a replication session (See the IBM Redbook IBM System Storage SAN Volume Controller and Storwize V7000 Replication Family Services for more information).
3) Review Spectrum Virtualize Error Logs
Review the Spectrum Virtualize error logs for the following errors:
- 1720 – In a Metro Mirror or Global Mirror operation, the relationship has stopped and lost synchronization, for a reason other than a persistent I/O error. You need to check the fabric logs and health of target cluster/nodes.
- 1920 – This is the most common indication of WAN bandwidth issues and usually follows a mirror relationship being taken offline due to the link tolerance (identification of link issues) going beyond 300 seconds.
- For GM with Change Volumes, consider adjusting the Cycling period. The default is 300 seconds. This is the amount of time that is allowed to copy all the changed grains to the secondary site before the next replication can start. If the changed grains are not completed from the first cycle than the next cycle will not start. The shorter cycle period the less opportunity there is for peak write I/O smoothing, and the more bandwidth you will need. We have seen modest improvements in front-end write response times for bandwidth constrained environments by setting this number higher but this does have the side effect of increasing the RPO/RTO.
A final tip for troubleshooting in a GM/MM situation: if you feel that replication might be the culprit for front-end write response time issues, but finding the proof turns out to be hard, then you could suspend the mirroring and see if the front-end write response times return to normal.
- If they do return to normal after suspending GM/MM, then the issue is related to GM/MM. Investigate the performance of the replication using the monitoring tips above.
- If the front-end write response times remain poor after suspending the GM/MM relationships, then the issue is not related to the GM/MM environment. You will need to look elsewhere.
What is your plan for protecting the availability of your IBM Spectrum Virtualize replication services?
(This blog was originally published in 2016. It was updated in 2022)
This article's author
Share this blog
Related Resources
Noisy Neighbors: Discovering Trouble-makers in a VMware Environment
Just a few bad LUNs in an SVC all flash storage pool have a profound effect on the I/O experience of the entire IBM Spectrum Virtualize (SVC) environment.
How to Choose the Best IBM Spectrum Virtualize Replication Technology
Choosing the wrong IBM Spectrum Virtualize (SVC / V7000) replication technology can put your entire availability at risk. This blog reviews each type of replication.
Improve Collaboration and Reporting with a Single View for Multi-Vendor Storage Performance
Learn how utilizing a single pane of glass for multi-vendor storage reporting and analysis improves not only the effectiveness of your reporting, but also the collaboration amongst team members and departments.
Request a Free Trial or Schedule a Demo Today
Discuss your technical or sales-related questions with our availability experts today

 Brett Allison