Small Changes Can Lead to Big Problems If Not Addressed
You may think that seismology and storage don’t have a lot in common, but I found a correlation between the two while I was looking at some Dell EMC VMAX data for one of our customers.
One of the purposes of a seismograph is to detect and trend tremors caused by stressors in underground rocks that can be precursors to a full-blown earthquake. Stressors in your storage infrastructure can also be harbingers of a performance issue. The difference is that we can address storage tremors before they become a full-blown performance quake.
Statistics, statistics, statistics
Statistical change detection in your SAN performance solution can compare the current day’s performance to that of the previous thirty days. Thirty days is a good baseline for comparison, as it catches weekends, workdays, and end of month workloads. Once you know what ‘normal’ is, you can then spot and trend deviations from that baseline.
A standard deviation is a number used to tell how measurements are spread from the average. Any standard deviation greater than ±1 from the average is notable. The lower the standard deviation, the less variance from the average. Figure 1 shows the standard deviation bell curve for a normal distribution.
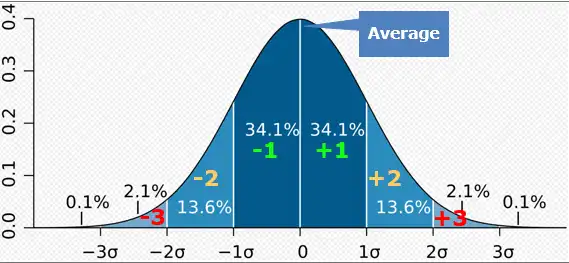
Figure 1: Standard Deviation Bell Curve
Note that 68.2% of all samples in a normal distribution fall into ±1 standard deviation and 95.4% are within ±2 standard deviations. Only the last 4.6% of samples are in the 3 or more standard deviations category and are exceptional.
Was that a tremor?
Using the statistical change detection built into IntelliMagic Vision, I noticed a change in both overall front-end response time as well as front-end read response time of almost 3 standard deviations while looking at a customer’s Dell EMC VMAX data, as shown in Figure 2. That is a significant deviation that should be investigated further.

Figure 2: Change in Front-End Response Time for Dell EMC VMAX
When plotted across the past month, you can see that the response time on this array has increased markedly over the past week, as seen in Figure 3.
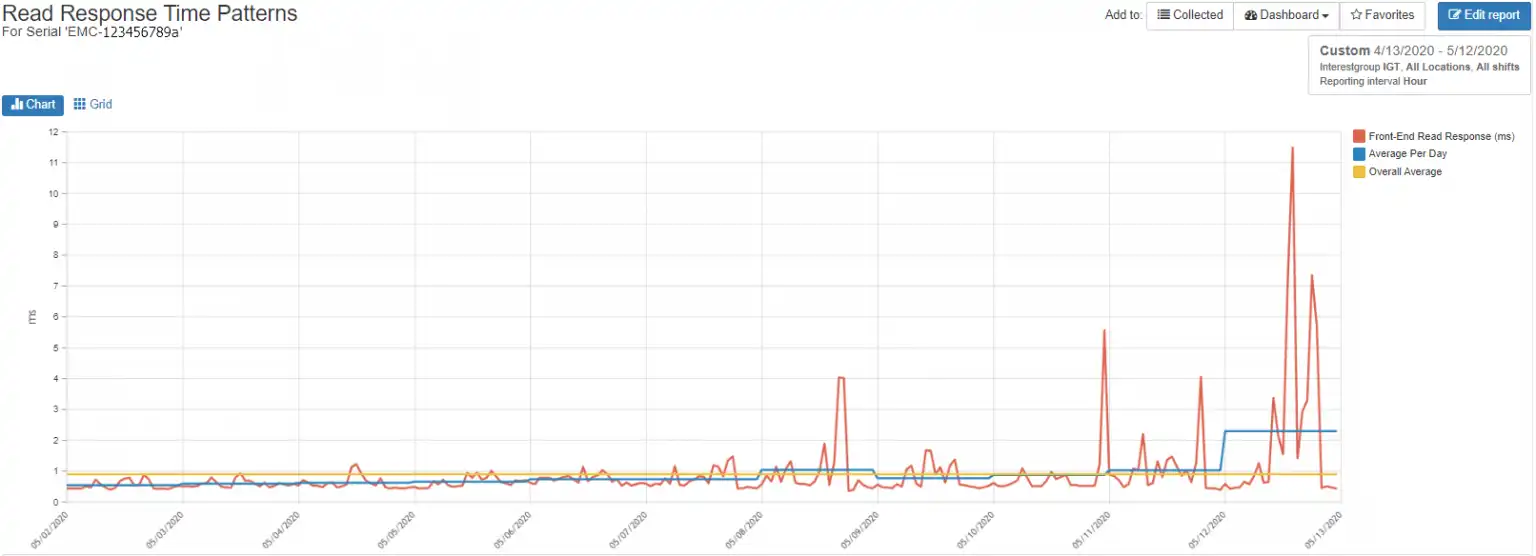
Figure 3: Read Response Time, Average Read Response Time, and Daily Average Read Response Time
The yellow line shows the average read response time for the month, the blue line shows the daily average, and the red line shows the read response time over the past 30 days.
When you look on the storage array for the day in question, there are peaks when the read response time exceeds the warning threshold, but overall the front-end read performance for this storage array is good as indicated by the green border of Figure 4. You can clearly see, however, the periods of increased response time.
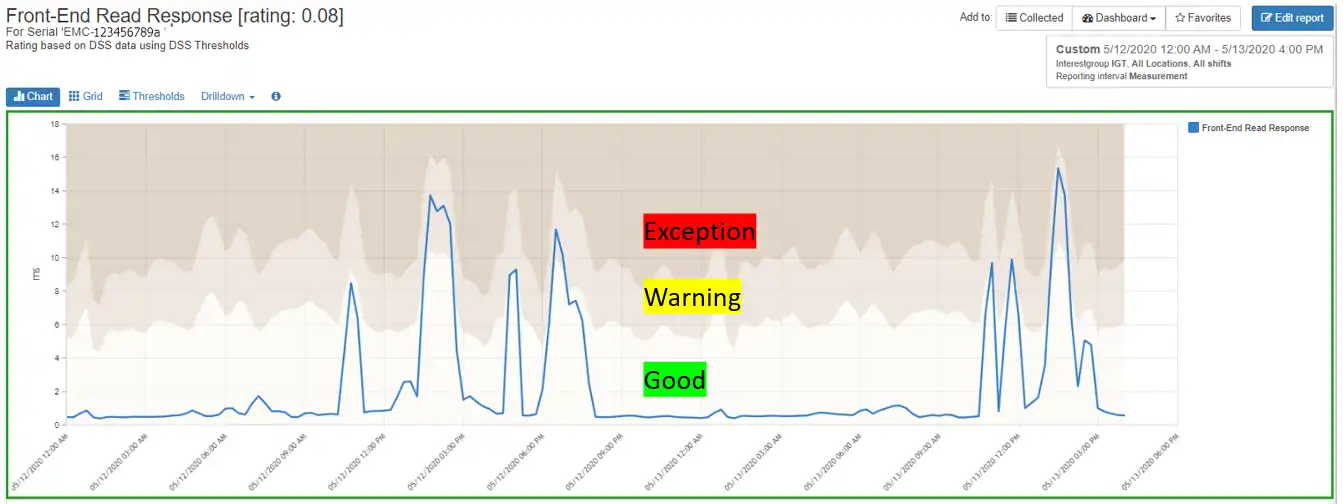
Figure 4: Front-End Read Response Time with Thresholds
This Dell EMC array has two storage pools, only one of which is showing the increased read response time, as shown in Figure 5.
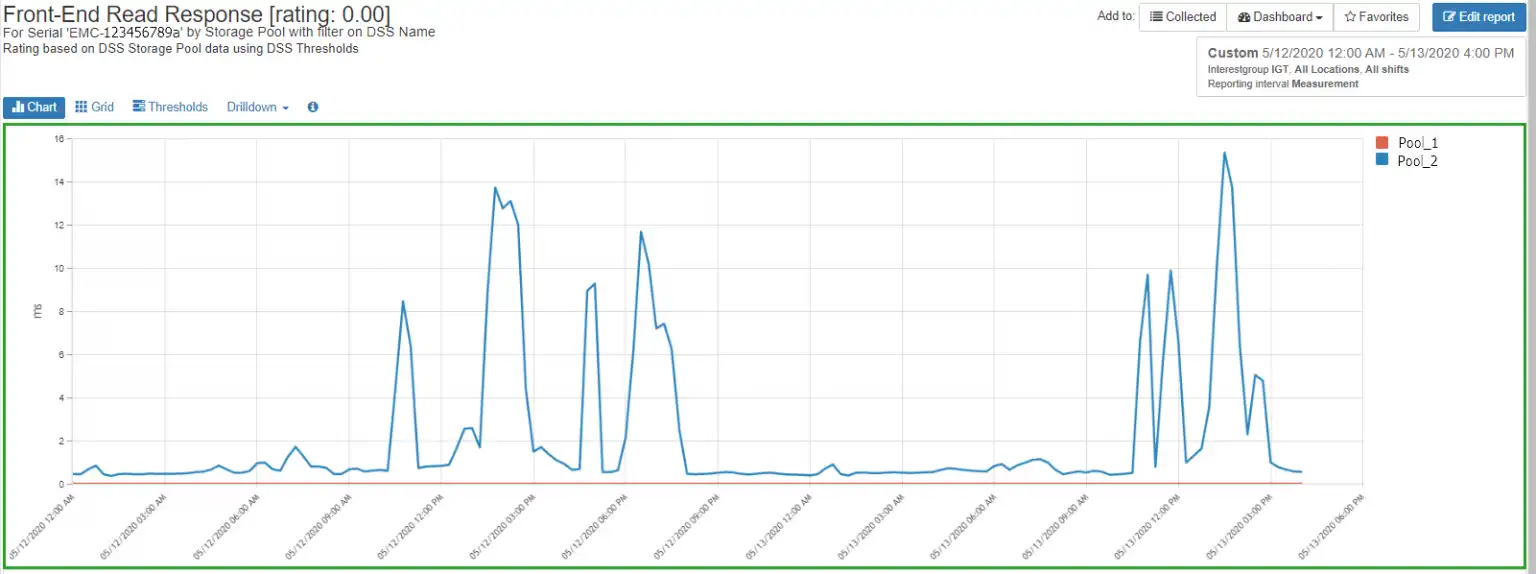
Figure 5: Pool Read Response Times
Within Pool_2, there is only one volume that is showing a significant increase in front-end response time, volume 00306, as shown in Figure 6.
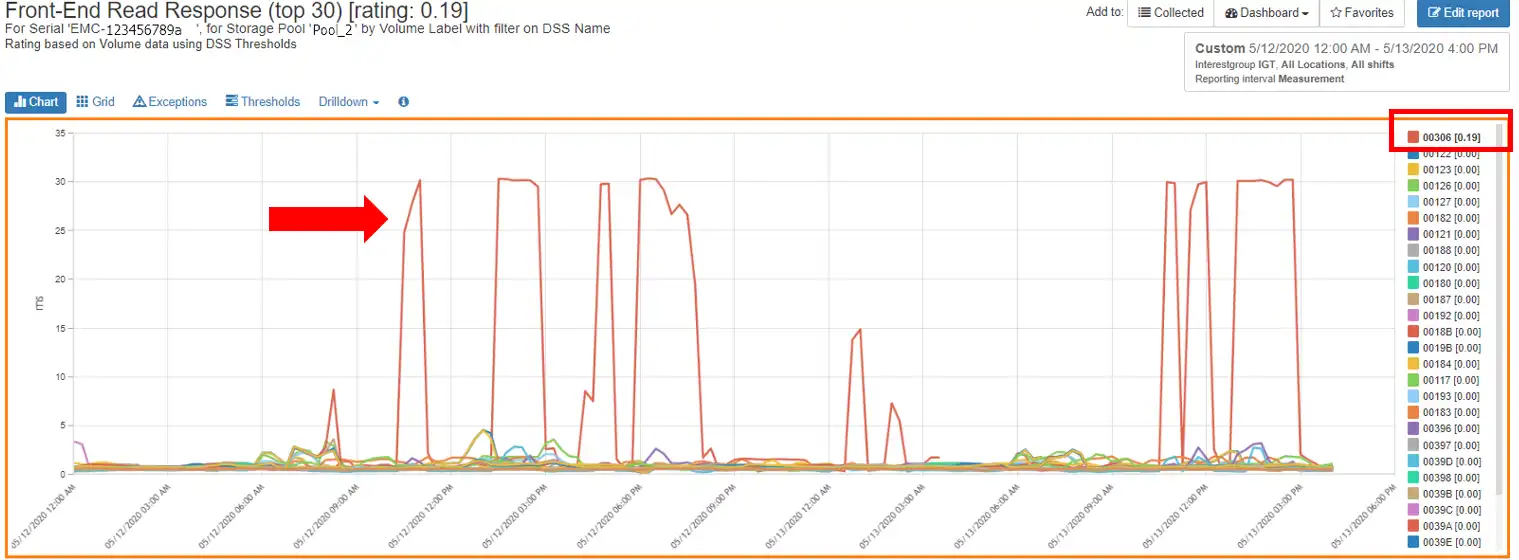
Figure 6: Active Volumes
When we look at cluster read and write throughput, we see the same I/O pattern in read and write throughput that corresponds with the increased front-end response time for cluster SQL_CLS_001 as shown in Figure 7.
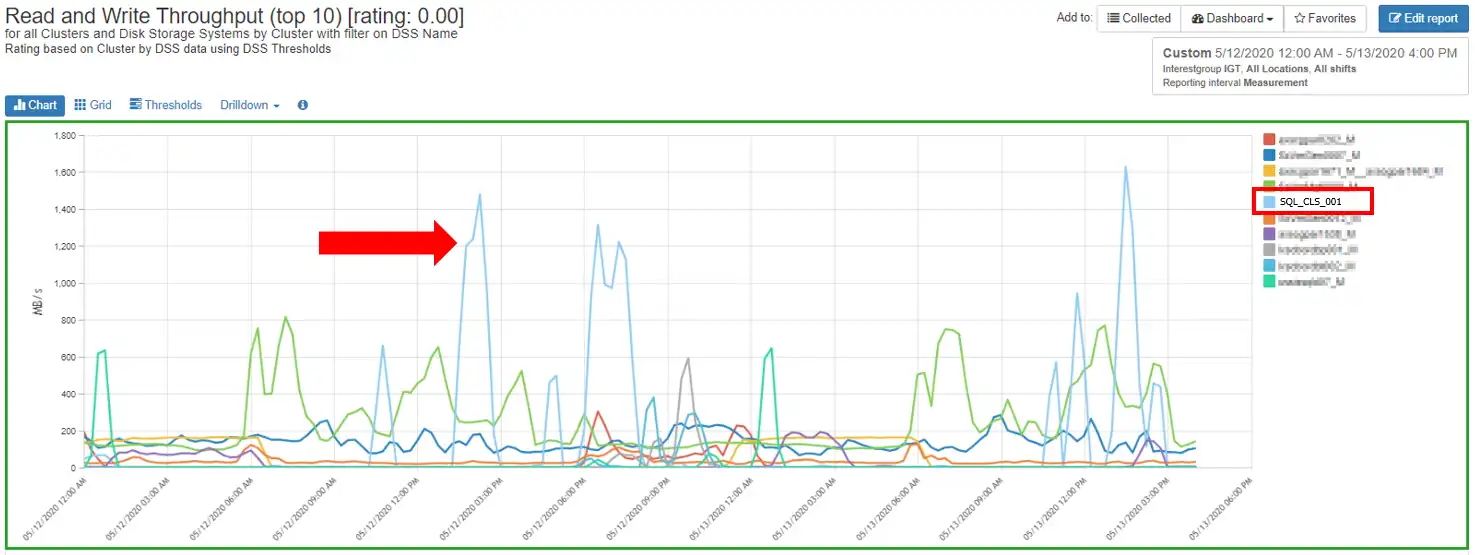
Figure 7: SQL Cluster Throughput
Furthermore, when we look at I/O Intensity, a measure of impact on response time (or I/O rate * response time), we see the same pattern on the volume we looked at earlier, volume 00306, as shown in Figure 8.
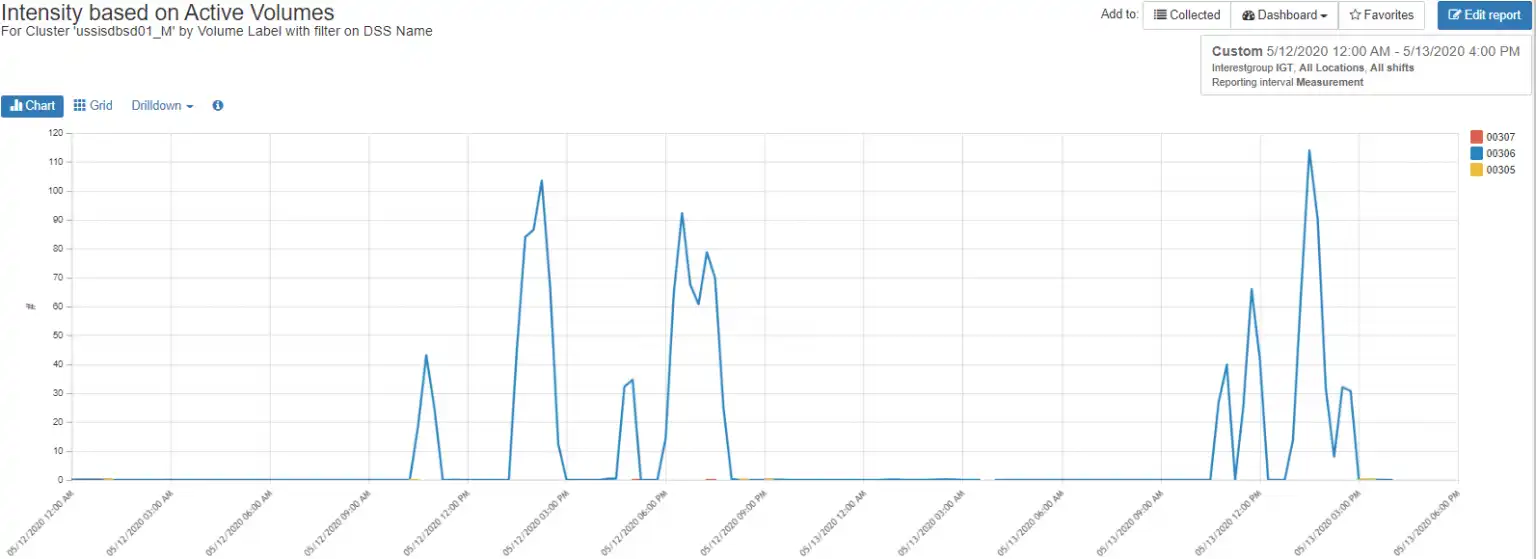
Figure 8: I/O Intensity
Finally, Figure 9 compares the I/O intensity for cluster SQL_CLS_001 to that of a week ago. You can see how dramatically the workload has increased.
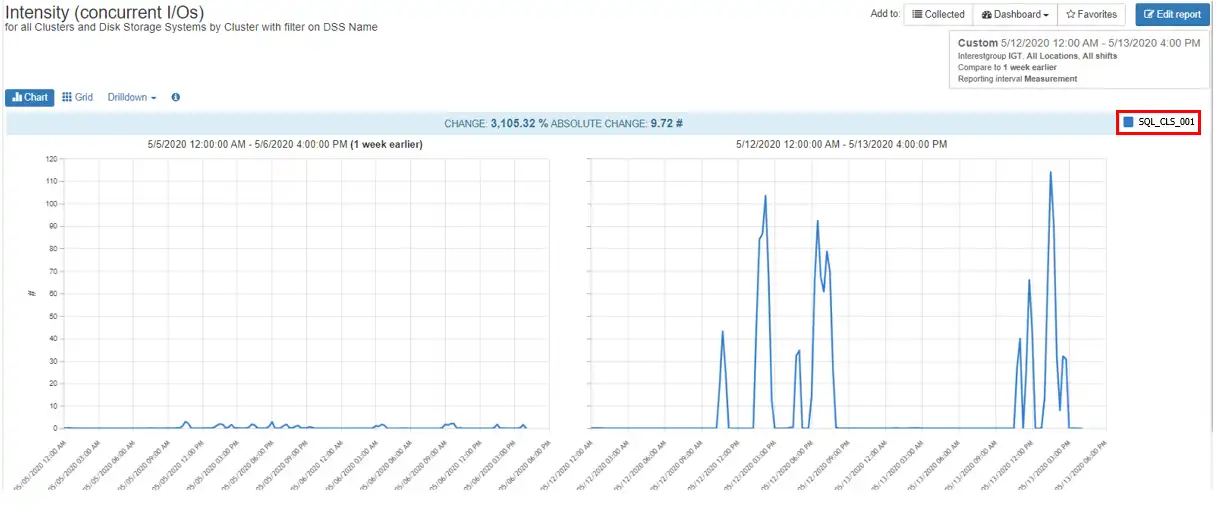
Figure 9: I/O Intensity vs Last Week
Although this increased workload isn’t yet affecting other hosts on the storage array, it is a dramatic change that is increasing over time. You now have the opportunity to work with the owners of SQL_CLS_001 to see what has changed to cause the dramatic workload increase and proactively adjust the environment before it causes an issue.
Finding the epicenter
Using multiple seismographs, a scientist can triangulate to find the epicenter of an earthquake. Similarly, using the right diagnostic equipment can allow you to look at different aspects of your storage array’s performance to find the source of the changing workload.
Manually comparing current statistics to a baseline is labor-intensive and cumbersome. IntelliMagic Vision automatically performs the statistical change detection analysis and points out deviations in the workload. Unlike an earthquake, we can address a tremor before it becomes an earthquake that causes poor performance or an outage. Wait… Did you just feel that?
This article's author
Share this blog
Related Resources
The Total Economic Impact of IBM Z IntelliMagic Vision for z/OS
Discover the benefits of IBM Z IntelliMagic Vision for z/OS. Watch the webinar for insights on cost savings, risk reduction, and ROI.
A Mainframe Roundtable: The Leaders | IntelliMagic zAcademy
Join industry leaders as they discuss the evolution of mainframes, sharing personal experiences, challenges, and future insights, along with practical advice from their careers in the Z ecosystem.
Integrating Mainframe Resource Consumption into the Business | IntelliMagic zAcademy
Discover how to apply FinOps in the mainframe ecosystem to better align IT resources with business objectives, optimizing costs and decisions.
Request a Free Trial or Schedule a Demo Today
Discuss your technical or sales-related questions with our availability experts today

 Tim Chilton