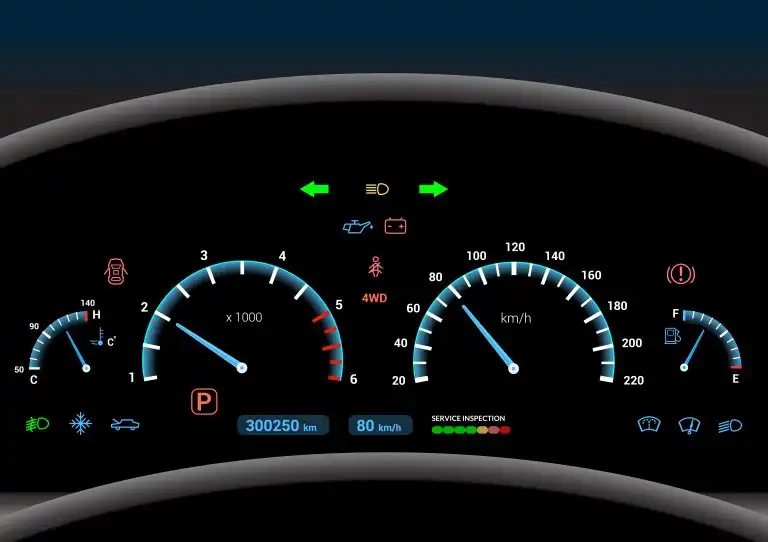
Imagine driving your car when, without warning, all of the dashboard lights came on at the same time. Yellow lights, red lights. Some blinking, while others even have audible alarms. You would be unable to identify the problem because you’d have too many warnings, too much input, too much display. You’d probably panic!

Car dashboard modern automobile control illuminated panel speed display vector illustration
That’s not likely, but if your car’s warning systems did operate that way, would it make any sense to you?
Conversely, if your car didn’t have any dashboard at all, how would you determine if your car was about to have a serious problem like very low oil pressure or antifreeze/coolant? Could you even operate it safely without an effective dashboard? Even the least expensive cars include sophisticated monitoring and easy interpretation of metrics into good and bad indicators on the dashboard.
You have a need for a similar dashboard of your z/OS mainframe to alarm you.
Early Warning System for z/OS Performance Monitors
When any part of the infrastructure starts to be at risk of not performing well, you need to know it, and sooner is better. By being warned of a risk in an infrastructure component’s ability to handle your peak workload, you can avoid the problem before it impacts production users or fix what is minor before the impact becomes major.
The only problem is that the static dashboards and reporting many sites are still using today for their z/OS infrastructure, and most z/OS monitoring tools, do not provide this type of early warning.
When I first started monitoring z/OS performance, I kept hearing mainframe engineers talking about ‘turning the knobs’ on an old MVS system. It took me a while to figure out what they meant by that comment.
It came to me when I recently saw an antique car that ran on steam, which is a nice illustration of what it means to ‘turn the knobs.’
Some knobs could be reached by the driver and other knobs could only be adjusted after the car was stopped. There were knobs seemingly everywhere, and it was if you had to be an engineering genius to know which knobs to turn and when to turn them to keep everything working well.
The dashboard of the old car had only basic gauges that required expert knowledge to interpret what they meant, whether the metric was good or bad.
Modern z/OS Mainframe Infrastructure Analysis
Incredibly, the metaphor of the gauges and dashboard of an antique car can be applied to much of today’s modern z/OS mainframe infrastructure.
z/OS has a richer source of machine-generated performance and configuration data than any other enterprise computing platform (RMF/SMF). The data from mainframes is collected and reported on using customized reports developed over many years.
However, despite the richness of data and mature reporting processes, automated health assessments of the data using expert knowledge about the infrastructure components is virtually non-existent.
In other words, mainframes have no easy-to-read dashboard to alert the operator of dangerous conditions.
Proactive Mainframe Performance Monitors
Mainframe operators and administrators are too busy to try and proactively analyze all of the data to identify risky conditions. Consequently, performance problems are most often not avoided proactively, but rather only after incidents and service disruptions where production work is already affected.
The reason for this is that it is very hard to build-in the expert knowledge about the infrastructure and use it effectively in the interpretation of the data.
Many software vendors, and perhaps also your custom RMF/SMF reports, offer ‘dashboards’. But, when you analyze their capabilities, these are limited views which are more like the dashboards of the antique automobile or old MVS systems with ‘knobs’ rather than a meaningful dashboard which includes built-in knowledge that both qualifies and rates the metrics proactively.
There is no question that your business needs a z/OS dashboard with monitoring that is at least as sophisticated as a modern car. It is now possible to turn your mainframe’s data into what we call ‘Availability Intelligence’ by mining it using built-in expert knowledge.
Mainframe Lag Measures Vs. Lead Measures
Of course, part of the problem is that reporting and monitoring at most mainframe shops focus on ‘lag measures’. Using the modern car analogy, mainframe lag measures would be like the tachometer (measuring RPMs) or speedometer (MPH/KPH).
An example of a lag measure for your mainframe systems is average response time. However, even with a pretty dashboard, these metrics are only symptomatic. In other words, they are not yet predictive.
To effectively maintain continuous availability of your mainframe system, you must monitor and respond to the ‘lead measures’ proactively, thereby avoiding many of the reactive panic situations caused by lagging measures having already gone into unacceptable ranges and affecting performance.
Conversely, a predictive lead measure has a significant influence on a lag measure because it can be dealt with quickly, and in a controlled fashion. A lead measure is changeable.
In a car, a drop in oil pressure is an important lead measure, as you can easily detect low oil pressure in any modern car today so that you can fix it before the engine is damaged.
For data storage, the utilization of the front-end adapters are a similar type of lead measure like the car’s oil pressure gauge, and should be monitored with alerting. As the adapters approach their saturation point during peak periods, you should be warned that high response times are just around the corner.
This, however, requires automated analysis of your workload metrics using built-in expert knowledge about the specific storage hardware in use. You can only react to these types of limits if you have z/OS systems and storage dashboards that display a warning triggered by out of range lead measures.
Modern z/OS Infrastructure Performance Dashboards
Dashboards need to make sense for your car and your z/OS mainframe performance:
- Too many lights on the dashboard would be overwhelming and distracting
- Warnings on the dashboard need to measure lead measures, as well as lag measures
- Good dashboards don’t require extraordinary expertise to interpret (like the antique car did)
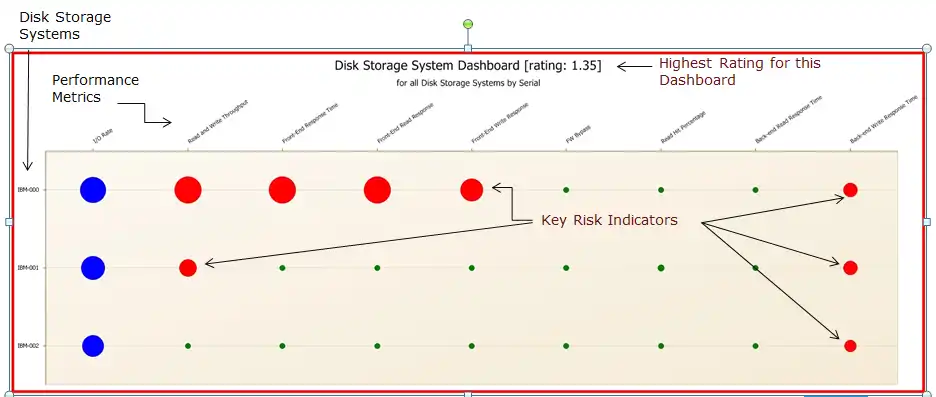
This is where the dashboards produced by IntelliMagic Vision not only excel, but are also unique. They are produced by mining the data with built-in expert domain knowledge, and they quickly point to areas that require focus before there is overwhelming trouble for the production applications.
IntelliMagic Vision dashboards use knowledge about the hardware, configuration, and workload to highlight lead measures that need attention well before the lag measure is affected.
For instance, if a lead measure such as back-end drive performance for Disk, an LPAR approaching its maximum share, or a Coupling Facility getting poor synchronous request response time, IntelliMagic Vision will point that out in a dashboard. Our software can also automatically provide an email to selected users if a warning indicator on a dashboard appears. Because these alerts are based on lead measures and not lag measures, false positives are drastically reduced, while false negatives are also avoided.
Monitor and Run Your Mainframe Performance Efficiently
Here’s a true story: I once had a van where I could not always see the dashboard at night. When I would get near a known speed trap, I inevitably got nervous and would think, “I hope I’m not speeding; and, if so, please don’t turn me in!”
The same is true with your mainframe. If you want to monitor and run your mainframe efficiently, and not panic about problems that might occur, you’ll need to use good dashboards that effectively summarize the meaning of your workload metrics in the context of your specific infrastructure.
Without both the understanding of the issue and your unique hardware, you’ll not have the leading indicators to proactively identify and resolve potential issues. That’s what IntelliMagic Vision does for your mainframe: providing you with the dashboards and metrics using built-in expert domain knowledge about your unique hardware to prevent issues from happening and solve them faster when they occur.
For more details about the expert knowledge and rating mechanism utilized in IntelliMagic’s z/OS dashboards, I recommend reviewing this whitepaper, z/OS Dashboards with IntelliMagic Vision. To find out how IntelliMagic Vision can work with your unique mainframe environment, please contact us. We are often able to use your historical RMF and SMF data from a previous incident to show you how the issue could have been avoided and demonstrate how it can help you prevent future issues.
If you would like to see how these dashboards and ratings can prevent disruptions and optimize your environment, learn more about our modern approach to performance management for z/OS systems here.
This article's author
Share this blog
Related Resources
What's New with IntelliMagic Vision for z/OS? 2024.2
February 26, 2024 | This month we've introduced changes to the presentation of Db2, CICS, and MQ variables from rates to counts, updates to Key Processor Configuration, and the inclusion of new report sets for CICS Transaction Event Counts.
A Mainframe Roundtable: The Leaders | IntelliMagic zAcademy
Join industry leaders as they discuss the evolution of mainframes, sharing personal experiences, challenges, and future insights, along with practical advice from their careers in the Z ecosystem.
Challenging the Skills Gap – The Next Generation Mainframers | IntelliMagic zAcademy
Hear from these young mainframe professionals on why they chose this career path and why they reject the notion that mainframes are obsolete.
Book a Demo or Connect With an Expert
Discuss your technical or sales-related questions with our mainframe experts today


 Jerry Street