In part one of this two-part series, “NetApp Performance Management 101: Key Metrics and Baseline Performance”, we explored the key metrics one should consider when measuring NetApp performance and provided some rules of thumb what constitutes good performance numbers. This blog will go a bit deeper into performance and discuss the factors that can affect how your NetApp FAS storage array serves data to its hosts and users.
Internal and External Factors Causing Poor NetApp Performance
If you’ve found that you have poor performance caused by latency, this latency can be caused by both internal and external factors to the NetApp array itself.
External Factors
If the cause of the performance issue is external to the storage array, the cause is typically at the host or on the network in use.
If the host is the cause of poor performance, it is most likely due to a malfunctioning or misconfigured HBA or NIC card or one of the ports on the HBA or NIC. Some things to look for are:
- Make sure that both the host HBA/NIC port and the switch port to which it connects are at maximum speed. A 10 gigabit Ethernet host port connected to the switch at 1 gigabit will never attain its full potential.
- Make sure that the HBA/NIC drivers are up-to-date and that the HBA or NIC card and drivers are on the NetApp hardware compatibility list (HCL).
- Regardless of whether block or file protocols are being used, you should use ports connected networks dedicated to data traffic. If you can also subdivide the data traffic between production traffic and backup traffic, that is better still.
- If using Ethernet based protocols, it is typically best to enable jumbo frames. If using jumbo frames, remember that they must be enabled through the entire data path to be effective.
- For best performance use separate VLANs for iSCSI, NFS, and SMB/CIFS traffic
- As with any equipment, check the NetApp best practices for configuring your solution.
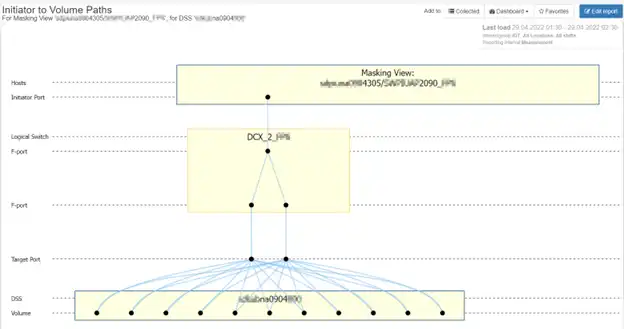
When checking external factors, it can be helpful to be able to visualize the entire data path with the ability to look at each component to check settings and performance. IntelliMagic Vision for SAN, for instance, can show you the entire data path with intuitive drilldowns that show configuration and performance metrics for the data path. Figure 1 shows a host connected to a NetApp storage array with a masking view that contains only one initiator.

Figure 1: Host with Anomalous Connectivity
This poses two threats. First this solution has no redundancy at the host, so the loss of the HBA port, the switch port, or the fiber connecting the two will result in the host losing its storage. Second, this host has only the bandwidth of one initiator available to it. If the port becomes saturated, the host will suffer from poor performance.
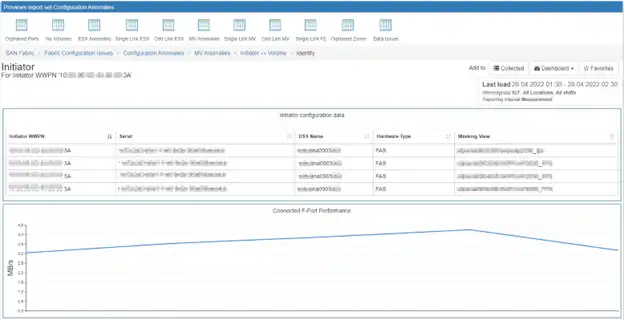
Figure 2 shows a drilldown from the topology chart to the underlying configuration and port data.

Figure 2: Drilldown to Port Configuration and Performance
Internal Factors
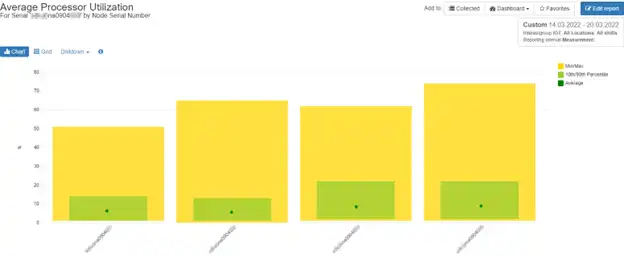
- If the array CPU, ports, cache, or disks are the cause of the bottleneck, consider using NetApp’s scale-out architecture to add controllers, disks, or shelves. NetApp architecture allows for nondisruptive scale-out, giving you the ability to scale when desired. Figure 3 is a balance chart for average processor utilization, with the green dot showing the overall average, the green box showing the 10th/90th percentile and the yellow box showing the minimum and maximum. The cluster shown is a 4-node cluster with all of the nodes’ average processor utilization below 10%. At peak, however, the nodes are at 51%, 65%, 62%, and 74% utilized, respectively. This is cause for concern for two reasons: nodes 2 and 4 have sufficient utilization that it’s starting to affect overall performance, and if any of the nodes in the cluster fail over cluster performance will suffer due to the receiving node being pushed to 100% utilization.

Figure 3: Balance Chart
- If you have spinning disks, consider implementing Flash Cache or Flash Pool. Both technologies allow the use of flash drives to serve as an intermediate cache between the cache and the disks, making a cache hit much more likely. Bear in mind that Flash Cache will benefit all aggregates in the system while Flash Pool will only benefit the aggregate to which it is attached.
- If a workload is on spinning disks and has high latency, move it to SSD drives for better performance.
- If an aggregate is suffering from poor performance, you can add precious IOPS to the pool by adding disks to the aggregate. You can also relieve pressure on an aggregate by moving some of the volumes to a different aggregate.
- Implement Storage Quality of Service (QoS) to improve performance for specific workloads.
- If you’re using deduplication, you can schedule deduplication activities during less active times of the workday/work week.
- When using database technologies, create separate LUNs for database storage and log files.
- If your aggregates are the constraining factor, consider consolidating smaller aggregates into larger ones. One large aggregate makes the I/O abilities of all drives available to all files, resulting in even workload distribution across all RAID groups. One large aggregate also enables the most efficient use of disk space.
- For optimal performance, NetApp recommends that you have at least 10% free space available in the aggregate.
…And That’s Just The Tip Of The NetApp Performance Iceberg
NetApp performance is a huge subject. This blog was just an overview of things to consider when doing performance analysis. A solution that can perform end-to-end storage and performance analytics can save valuable time and shorten mean time to resolution (MTTR). IntelliMagic Vision gives you that end to end picture, allowing you to analyze performance with just a few mouse clicks.
Click here to start a free trial of IntelliMagic Vision for SAN and try it out for yourself.
This article's author
Share this blog
Related NetApp Resources
NetApp Performance Management 101: Key Metrics and Baseline Performance
Learn about NetApp key metrics and how to use them to understand and troubleshoot host performance issues.
Improve Collaboration and Reporting with a Single View for Multi-Vendor Storage Performance
Learn how utilizing a single pane of glass for multi-vendor storage reporting and analysis improves not only the effectiveness of your reporting, but also the collaboration amongst team members and departments.
A Single View for Managing Multi-Vendor SAN Infrastructure
Managing a SAN environment with a mix of storage vendors is always challenging because you have to rely on multiple tools to keep storage devices and systems functioning like they should.
Request a Free Trial or Schedule a Demo Today
Discuss your technical or sales-related questions with our availability experts today

 Tim Chilton