IntelliMagic Vision release 9.6.0 supports WebSphere transaction analysis helping the z/OS systems engineer with the WebSphere management challenges.
IBM’s WebSphere is the webserver for z/OS. It has a long history, during which various monitoring records were developed. The SMF 120 subtype 9 is the culmination of this history for transactions. It provides the details on where the work runs, and what the work is. For each transaction, the processor consumption, the transferred number of bytes and the resulting response times are monitored.
WebSphere management challenges
z/OS system engineers and performance analysts need to:
- Make sure that the service level expectations from the users are met
- Make sure that no significant dispatch or queue delays occur
- Track the resource consumption for the WebSphere environment, but also for individual clusters or URIs
- Compare today with last week or last month, to investigate resource usage trends.
- Check the data volume for the transactions, to make sure that application changes did not impact caching at the workstations
- Plan for capacity based on long-term trends
IntelliMagic Vision’s solution for WebSphere
To support all these applications, IntelliMagic Vision summarizes the transaction data on a per interval basis. This makes the analysis feasible. “It is nice to have 100 million transaction records. But to understand that is going on, you will need to aggregate the data. So that is what we do.”, says IntelliMagic founder and CEO, Dr. Gilbert Houtekamer.
When we say transaction data is aggregated in IntelliMagic Vision, it means that all transactions (per LPAR) that have the same value for each of the 10 metrics (System, Cell, Node, Cluster, Server, Servant, URI, Hostname, Request Type and Transaction Class) above are grouped. So even the summarized data has a lot of detailed information.
Examples of IntelliMagic Vision’s WebSphere reporting
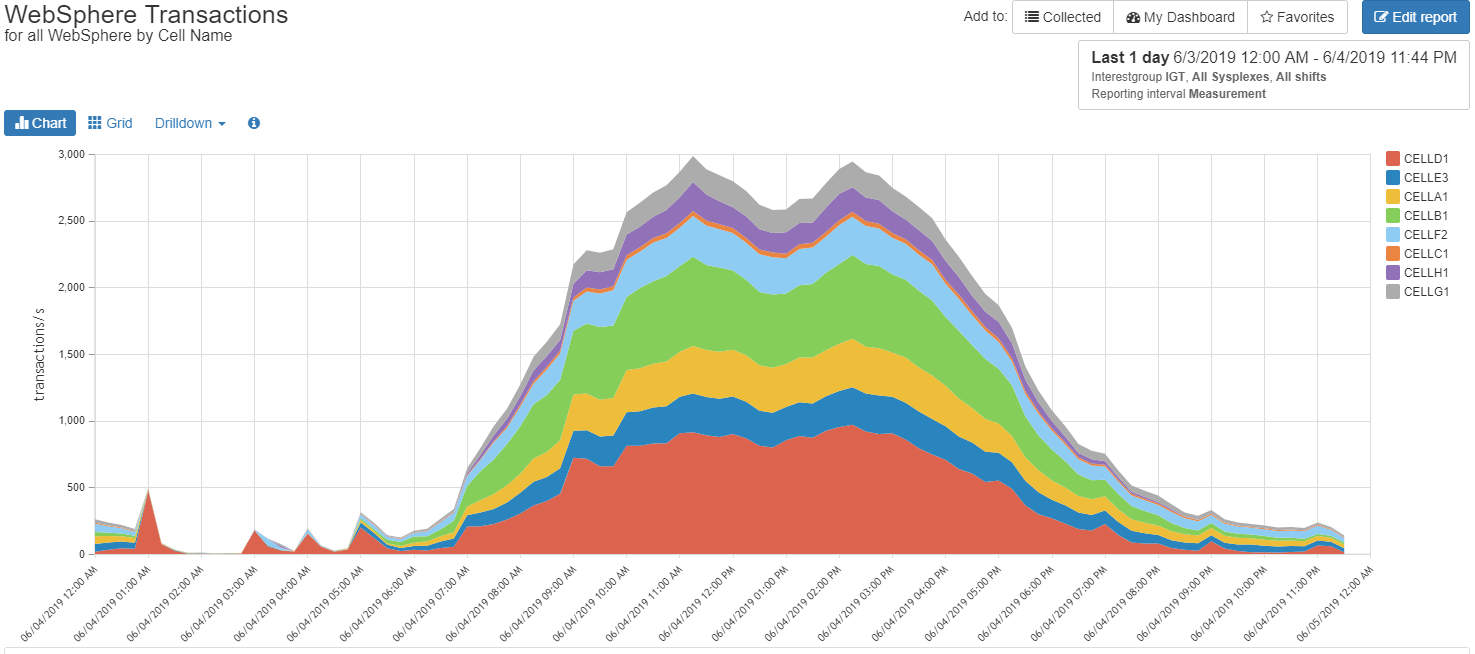
IntelliMagic Vision provides both the high-level view of the WebSphere activity, and the ability to drilldown to how individual servers process the work for a particular URI. The general approach with the IntelliMagic Vision interface is to first show a high-level chart, for example the transaction rate for each cell.
From the cells, you can drilldown to the clusters on a cell, and from there to the URI’s served by the cluster. Perhaps equally important as the number of transactions, is the processor usage for the workload. IntelliMagic Vision provides many perspectives on this, both overall and on a per transaction basis.
Customizable Reports
Out of the box IntelliMagic Vision provides many reports and drilldowns. But it is also very easy to change reports to your liking if you cannot find what you are looking for. Suppose you would like to view the data volume by URI-type for HTTP traffic. To make sure your z/OS server is not most serving templates. With IntelliMagic Vision this is now very easy to do.
Related resources
Troubleshoot High CPU and zIIP Utilization in WebSphere Application Server
A common problem performance analysts encounter is high CPU utilization on a server or application without the ability to identify the root cause of the problem quickly and easily.
Monitor WebSphere Data Volumes
This video introduces the topic of transaction reporting based on the SMF 120 subtype 9 record, specifically in terms of data volume per request/response.
Monitor WebSphere Response Times
This video introduces the topic of transaction response time reporting based on the SMF 120 subtype 9 record.
