The vampire analogy here lies in the often undetected IT resource thieves that silently pull demand out of your systems like so many electronic devices that consume electricity in your home while you’re away. All these little things add up, and your electricity bill climbs for no good reason. IT resource vampires masquerade as software defects, misconfigurations, and sub-optimal hardware settings, and some of them are non-trivial.
Do you find yourself with higher IT costs, and nothing more of value to deliver to the business? Perhaps you need to look a little closer in some dark corners.
Are Vampires Sucking Up Your Whitespace?
You may have some extra capacity at present because you have some headroom as you prepare for the peak season. However, that doesn’t mean you should be generous with your IT resources.
In fact, instead of watching those resources slip away to the plethora of consumers, some who misbehave, why not stop some of those IT vampires in their tracks before they suck the life blood out of your systems?
In a world where there are Gigabytes of data each day to collect, analyze, and correlate from dozens, if not hundreds of systems, components and applications, the likelihood of finding these vampires is low. When these resource drains are left untouched, your overall costs will go up without an increase in revenue that can be tied to it.
When is the last time you caught a resource vampire? Or even crazier, have you ever heard anyone say, “Our software and people are so good, that we are going to forego hardware purchases next year by re-deploying all wasteful usage to meet all of our business growth.”
This sounds unlikely to most of us. In fact, you will probably keep adding capacity whether your business can justify the growth or not to prevent an outage – and you should. Unless, you have something that helps identify and act on the behaviors at a workload level – even down to the dataset and address space level.
Detecting a Resource Vampire Before it Strikes
Solutions that automatically alert you to the issues before your applications are impacted are what you need. Embedded expertise that warns you when there is a problem brewing will help. Even better, when it’s combined with some constructive commentary, the results provide actionable information that prevents performance and availability issues and keeps unnecessary resource demand in check.
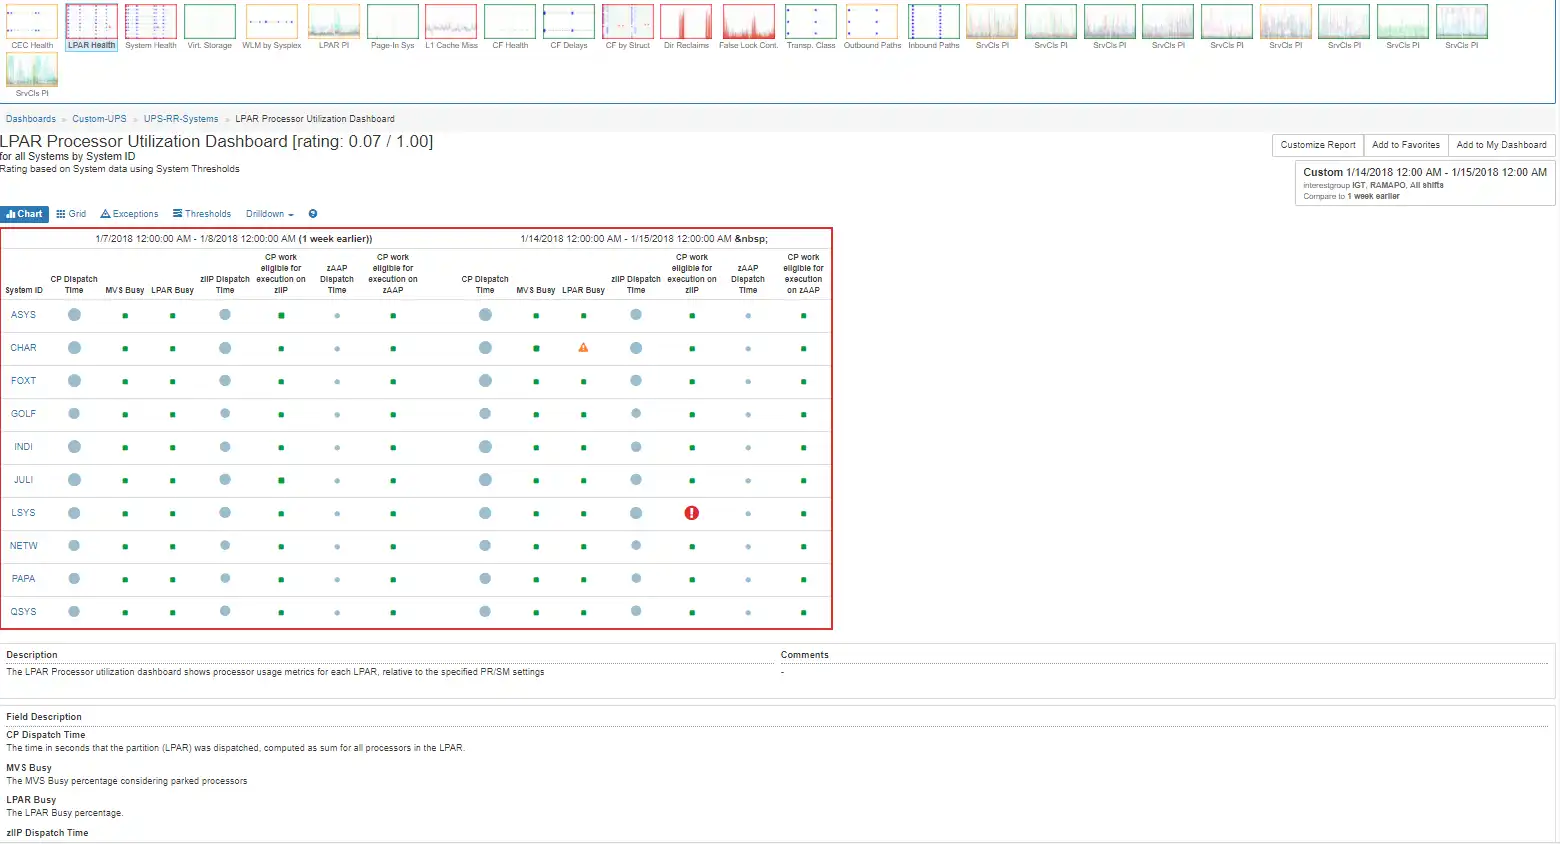
The visual below provides a rated bubble chart with one red indicator for excessive zIIP eligible work on a general-purpose engine.
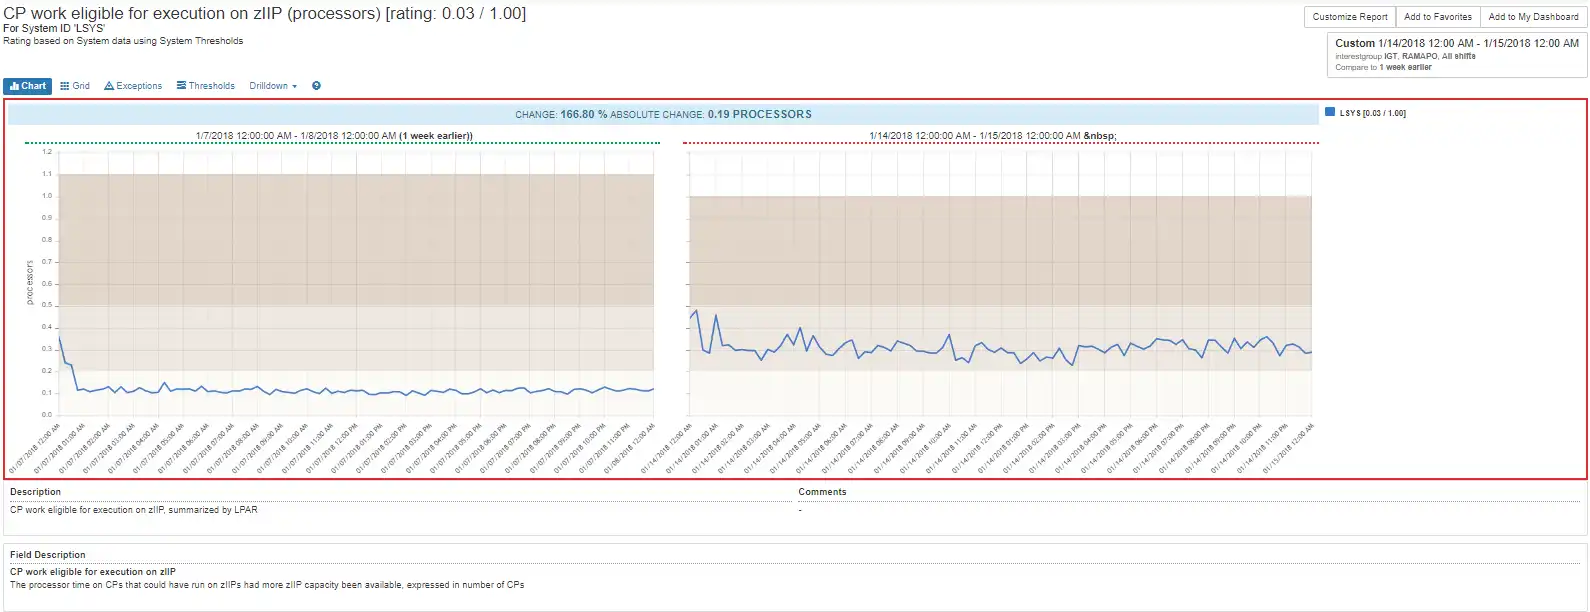
Probing into that system provides a view of the last day as compared to the week prior – a common baselining technique easily selected within IntelliMagic Vision.
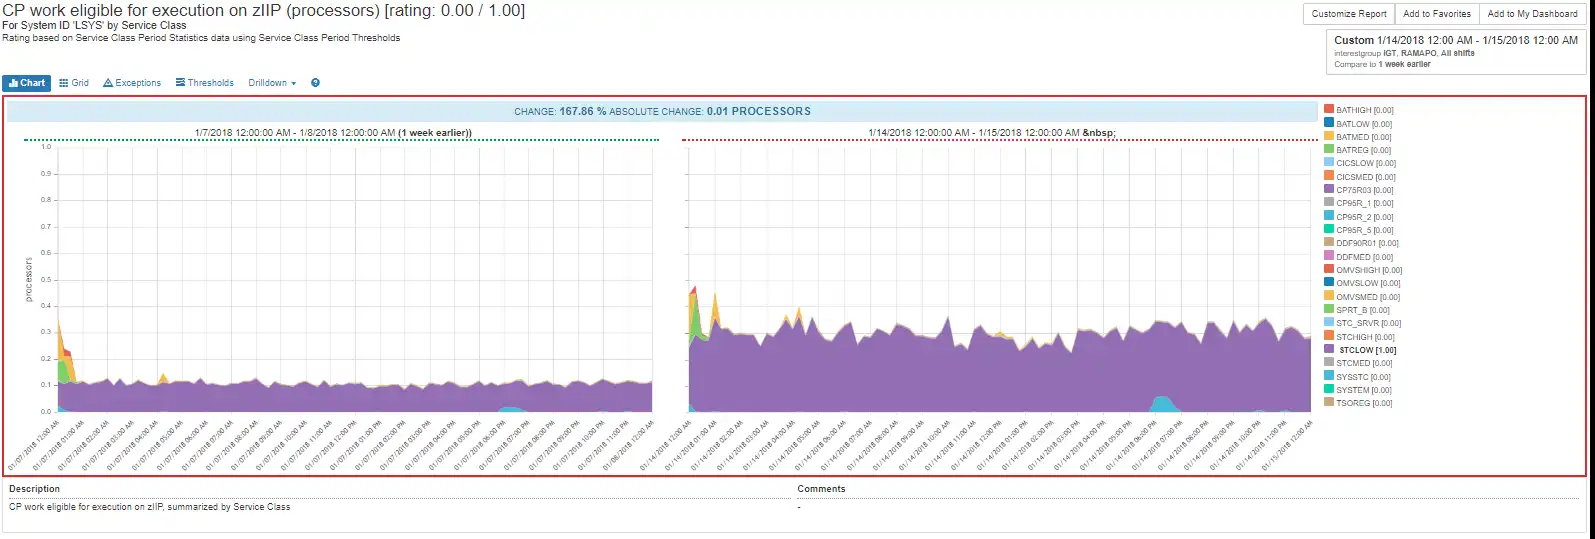
Zooming into the view below, this bad behavior is highly correlated with the demand from a rather generic (STCLOW) service class.
A Few Clicks to Driving the Stake
In just a few clicks, we found the service class, the LPAR and the size of the General Processor vampire demand. In a few more clicks, you can know that the problem is not surprisingly affecting zIIP demand, too.
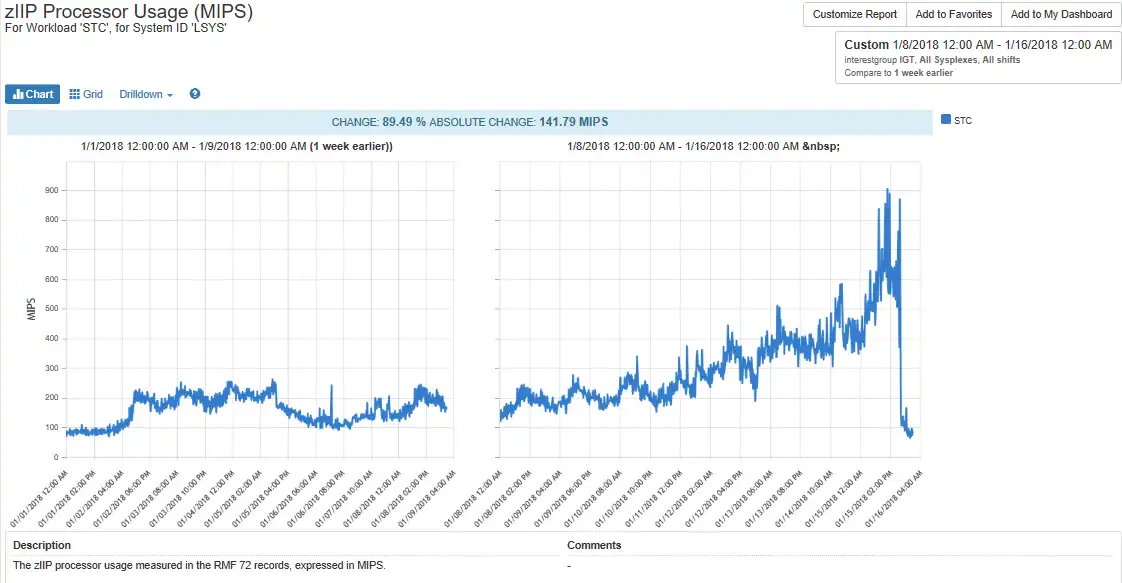
In fact, once we remedy the problem we see that it was consuming 900 MIPS of zIIP capacity and was also driving 300 MIPS work onto the general CP (two charts below). If this is your internal software, you would be opening a defect with the application owner; if it was COTS software, perhaps a rebate is in order until the vendor remedies this problem. Regardless, you have what’s required to drive a wooden stake home and prevent another occurrence.
The growth below shows the exponential zIIP growth that eclipses 900 MIPS in two weeks.
The CP work eligible for zIIP processing on the CP was remedied on January 16th, but was over 700 MIPS which likely impacted the MLC for January.
Hidden Issues Can Drain Your Resources, Time, and Money
This example demonstrates that problems that affect the bottom line are often unseen and may grow beyond the system’s ability to handle them. Systems can mask issues that cost real money because they have prioritization and protections in place, but those same features may hide unnecessary resource demands without capable solutions. To be truly effective, a z/OS performance monitoring system must include:
- Automated data collection
- Automated analysis supported by best practices, and embedded expertise
- Helpful visualizations
- Actionable information
Do you Have any Vampires?
Do you remember the last occurrence of vampire demand you found? As mentioned earlier, the complexity of systems and volume of data make it harder to find and difficult to develop into actionable information. Unfortunately, this circumstance may become more and more common unless good solutions and expertise are applied.
Unless your customers are experiencing real pain, identifying vampire demand, defining the cause and applying the remediation may never occur, which results in increased costs-without good justification. If you wait until there is pain and your applications are affected by performance issues, you could find the problem after developing multiple ad hoc queries with other solutions.
Ad hoc queries are reactive, not preventive. The effort to find one vampire after an outage or performance problem is unlikely to find the next issue. When these issues are not found, the result is infrastructure cost growth that doesn’t align with business growth.
This article's author
Share this blog
Related Resources
Why Am I Still Seeing zIIP Eligible Work?
zIIP-eligible CPU consumption that overflows onto general purpose CPs (GCPs) – known as “zIIP crossover” - is a key focal point for software cost savings. However, despite your meticulous efforts, it is possible that zIIP crossover work is still consuming GCP cycles unnecessarily.
New to z/OS Performance? 10 Ways to Help Maintain Performance and Cost | IntelliMagic zAcademy
This webinar will delve into strategies for managing z/OS performance and costs. You'll gain insights into key metrics, learn how to identify bottlenecks, and discover tips for reducing costs.
Top ‘IntelliMagic zAcademy’ Webinars of 2023
View the top rated mainframe performance webinars of 2023 covering insights on the z16, overcoming skills gap challenges, understanding z/OS configuration, and more!
Book a Demo or Connect With an Expert
Discuss your technical or sales-related questions with our mainframe experts today


 Jack Opgenorth