Why is performance availability and cost optimization on z/OS so difficult? z/OS has a richer source of machine-generated performance and configuration data than any other enterprise computing platform in the form of RMF and SMF data, so the problem certainly isn’t a lack of data.
The difficulty likely has to deal with the increased complexity and size/scope of the infrastructure, the extreme amounts of data that is produced and must be constantly assessed and analyzed, the reduction of true experts due to retirements, and the industry’s reliance on code-heavy, static, SAS/MXG reports.
So, what can be done about it? IntelliMagic’s Managing Director, Brent Phillips, and Senior Performance Consultant, Jerry Street, recently took on this topic in the webinar, “Best Practices for z/OS Application Infrastructure Availability.”
Here’s a look at 10 of those best practices.
1. Give the Team a Technological Force Multiplier
With historically low headcount ratios and an accelerating skills gap, a process such as SAS/MXG that requires deep expertise to both write and interpret reports is no longer feasible as it once was.
Additionally, teams don’t need another reporting tool – they already have more reports than they can feasibly manage. What they need is a force-multiplier in the form of allowing the machine to handle the automating of the analysis and interpretation of the data.
In short, stop using an abacus when you have a calculator. Empower IT staff with the power of the machine to help them make more educated decisions without manually poring over thousands of reports.
When utilized correctly, and combined with human expert knowledge, Artificial Intelligence (AI) will dramatically simplify and streamline complex processes and tasks for performance and capacity teams. Teams who are encouraged to be proactive will be able to take advantage of the numerous benefits AI offers.
2. Interpret the Data with Machine-Powered Contextual Analysis
For z/OS performance analysts, the process of generating reports from RMF and SMF data and eyeballing many static reports to try to determine whether they represent performance risks, problems, or infrastructure inefficiencies is a challenge too unfeasible to achieve optimal performance and cost efficiency.
Smart algorithms can interpret the metrics in the context of the infrastructure capabilities and best practices to provide true predictive capabilities. And statistical analysis can identify significant workload changes with minimal false positives without killing false negatives.
Attributes of a Force-Multiplying Solution
These two first best practices get to the root of the issue that it is no longer feasible to achieve performance availability and cost optimization without a powerful, modern solution that is dedicated to achieving both of those goals.
So what attributes are necessary of that modern solution?
3. Interactivity
As previously stated, a set of static reports that require manual coding or expert level understanding to know where to investigate further is no longer an effective solution for most environments! Thus, interactivity is an essential feature so analysts can quickly and easily navigate through the data and find root causes, hidden bottlenecks, or other risks.
4. Predicts Problems and is Prescriptive
The status quo has generally been that service disruptions to application availability are unavoidable. Try to keep the environment as optimized as possible, but when there is a disruption to an application, fix it as quickly as possible.
That has led to the popularity of “real-time monitors.” When disruptions are inevitable, a real time monitor will let you know as soon as it occurs so you can put out the fire. But intelligent solutions will be able to predict issues before they ever impact availability by combining an understanding of the hardware capabilities and an environment’s specific workload needs. See Figure 1 below.
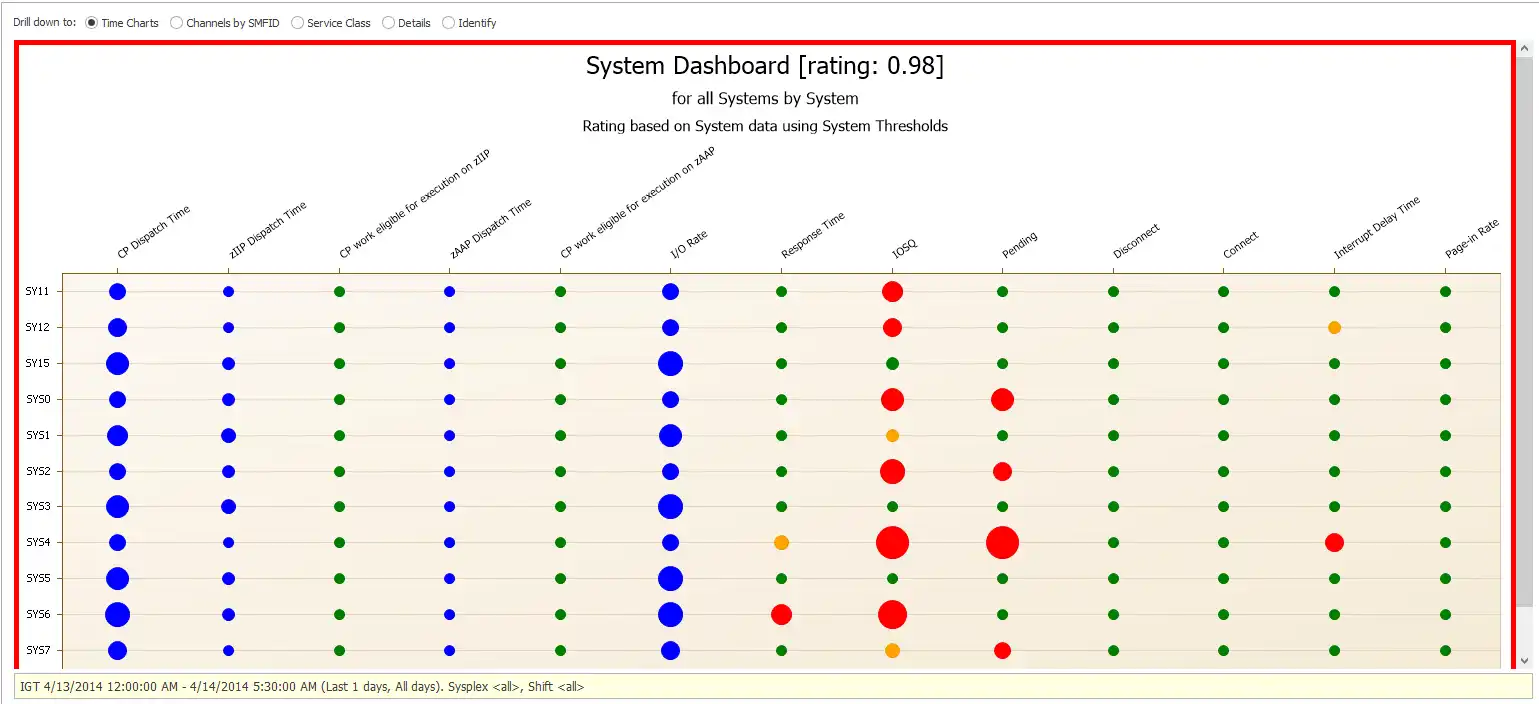
Figure 1: Health and Risk Status of Systems
Every bubble in Figure 1 represents the health and risk status for each key metric (x-axis) for every System that is being rated (y-axis). An intelligent, AI-driven solution will have these ratings built-in so as soon as you log in to your interactive dashboard, immediate exceptions (red bubbles) and upcoming risks that should be explored (yellow bubbles) can be immediately identified without needing to code any charts or dashboards.
5. Generates Cost Optimization Intelligence
“Applications are the profit centers and infrastructure is the cost driver.” That’s typically how management views things while ignoring that the availability of those applications is dependent upon an optimally running infrastructure.
However, it is true that infrastructure costs can run high, so it’s a best practice for your performance solution to include cost optimization intelligence built into it so you can manage costs efficiently without sacrificing performance. Understanding how the two interact and affect each other is a requirement for this. See Figure 2.
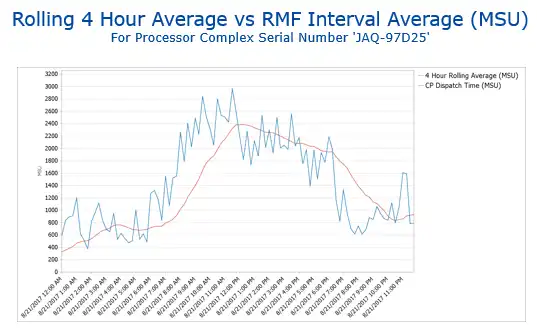
Figure 2: Analyze CPU cost and usage
6. Compares and Highlights Changes
In most situations, just looking at a performance exception (even one that is rated), is not enough to determine what the problem is, or if it’s even a problem at all. That’s where trending and comparing data comes in.
Intelligent solutions should allow you to interact with the current data and compare the metrics with the previous day, week, month, day of the week, or any other interval that is relevant. This offers insight into whether a performance exception is indeed a serious spike that needs immediate attention, or if it’s a normal trend. See Figure 3.
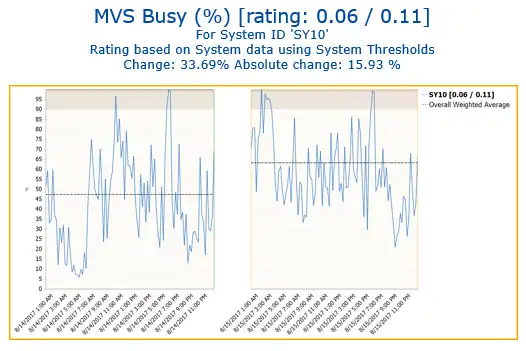
Figure 3: Comparing two time intervals
7. Identifies Workload Sources and Infrastructure Elements
When an issue is flagged, you need to be able to identify which workload or infrastructure element is to blame or needs to be tuned.
Knowing where to look and how to look through the many metrics and reports provided by RMF/SMF data requires an easy, intelligent solution. See Figure 4.
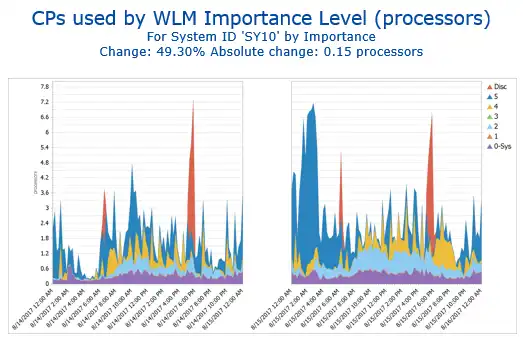
Figure 4: Analyze workload changes
8. Supports Application Infrastructure Views
Many z/OS resources are shared among many workloads, and it’s important to be able to segment those out from shared resources so you can report on them. This includes report classes, service classes and even volsers that may need to be grouped together.
This is useful to see before and after a change to verify what is happening in your system is what was predicted by the application group making the change.
Figure 5 below shows views from a data warehouse application, where service classes are grouped together, and we can see what service classes have increased in use.
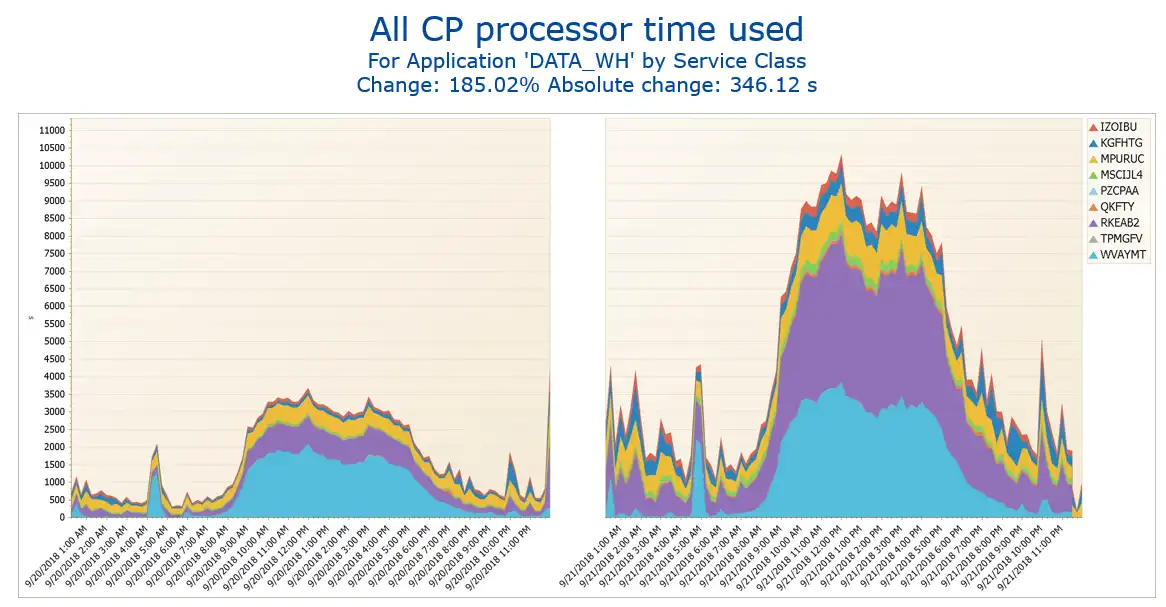
Figure 5: Analyze shared CPU usage
Having this information grouped by application infrastructure views helps us make better decisions.
9. Utilizes White Box Analytics
Analyzing many related metrics at one time turns the old “black box” analytics into “white box” or “clear box” analytics. Figure 6 below shows an example of white box analytics for one DSS. At a glance, you can see many related metrics that provide a clear analytical picture of the performance within this DSS.
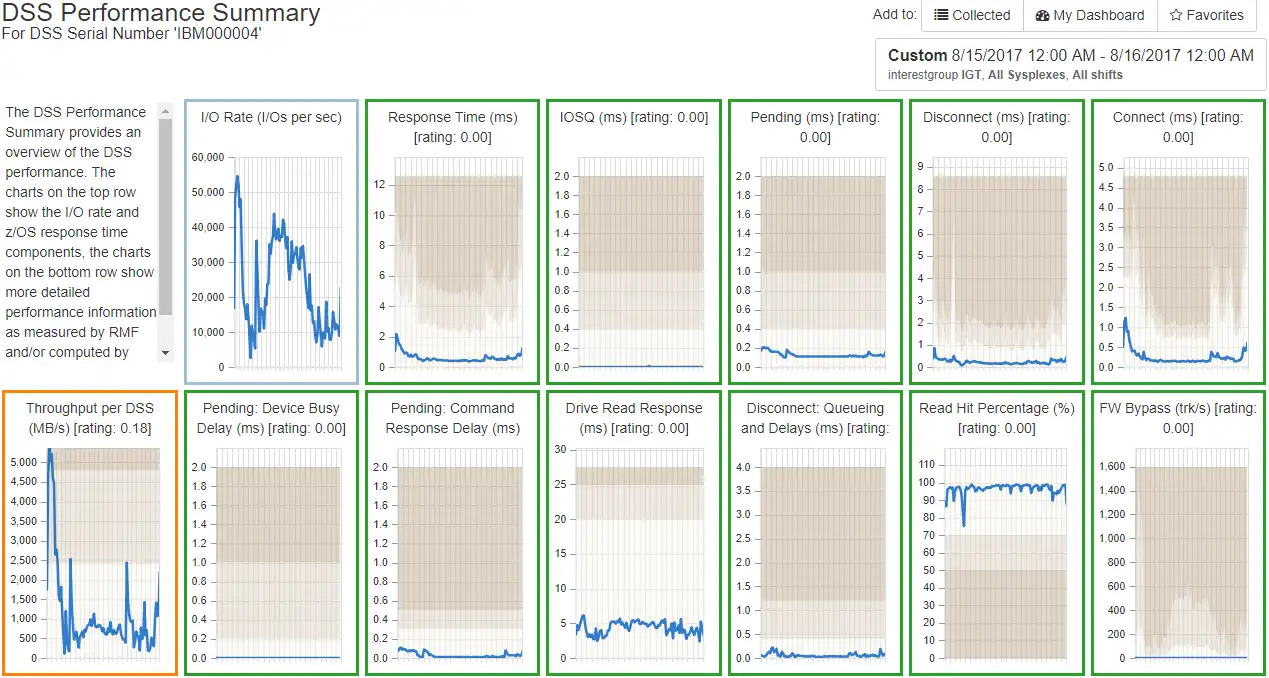
Figure 6: White Box analytics for DSS performance
10. Powerfully Bridges the Skills Gap
Because of the complexity of the RMF/SMF data, there are skills gaps for both new employees and seasoned engineers alike. A solution that is intuitive, easy to use, encompasses the entire environment, and teaches and explains is critical to keep everyone up-to-speed on old and new performance metrics alike.

Figure 7: Example of an Early Warning for TCP/IP
The Key to Optimizing z/OS Costs and Performance
RMF and SMF data already provide all the information a z/OS performance analyst needs to ensure optimal performance and keep costs to a minimum. The challenge is in efficiently accessing that data.
Machine intelligence is designed to automate that processes far more effectively than humans.
That automation includes processing the data, correlating it, and giving it a risk rating or score based on the hardware capabilities and workload requirements. When this process is automated and presented to an analyst in a graphical interface that is easy to use, customize, and navigate, then cost and performance optimization becomes not only achievable, but easily so!
This article's author
Share this blog
Related Resources
Making Sense of the Many I/O Count Fields in SMF | Cheryl Watson's Tuning Letter
In this reprint from Cheryl Watson’s Tuning Letter, Todd Havekost addresses a question about the different fields in SMF records having different values.
What's New with IntelliMagic Vision for z/OS? 2024.2
February 26, 2024 | This month we've introduced changes to the presentation of Db2, CICS, and MQ variables from rates to counts, updates to Key Processor Configuration, and the inclusion of new report sets for CICS Transaction Event Counts.
Expanding Role of Sub-Capacity Processors in Today's Mainframe Configurations | Cheryl Watson's Tuning Letter
In this reprint from Cheryl Watson’s Tuning Letter, Todd Havekost delves into the role of sub-capacity processors in mainframe upgrades, providing insights on transitioning to a more efficient CPC.
Book a Demo or Connect With an Expert
Discuss your technical or sales-related questions with our mainframe experts today

 Morgan Oats